Pictures from Plotchart 2.0
Arjen Markus (2 september 2010) Work on Plotchart is progressing - Torsten Berg and I are working on some new features that will make it much easier to customize the appearance of the plots and charts you can create (via a "style engine"). Other new stuff: more drawing options, support for animations. This will all become Plotchart version 2.0 (without too much incompatibility with previous versions - preferably none at all).
I want to show some of the results we have now (for the moment without the code):
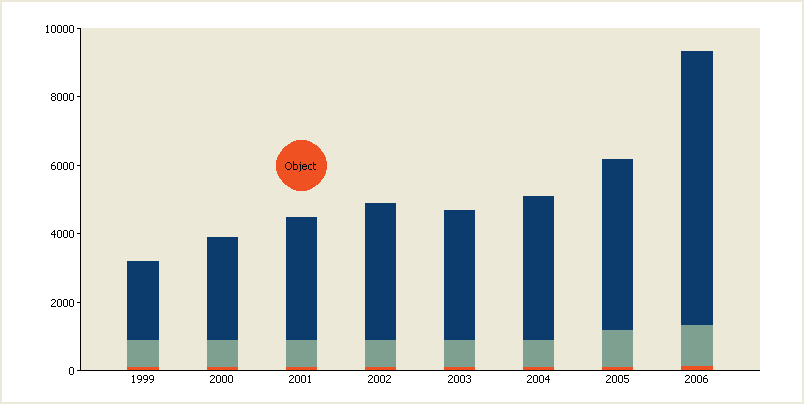
Barchart with custom colors and custom bar width:
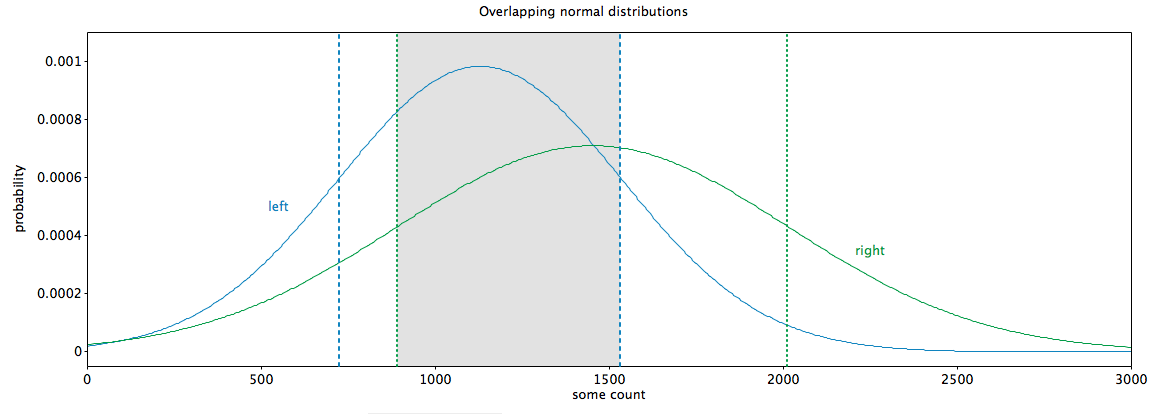
XY-plot with annotations:
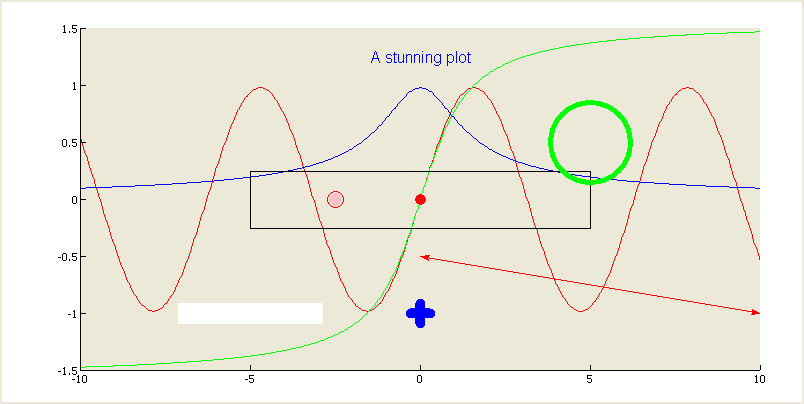
XY-Plot with some arbitrary objects:
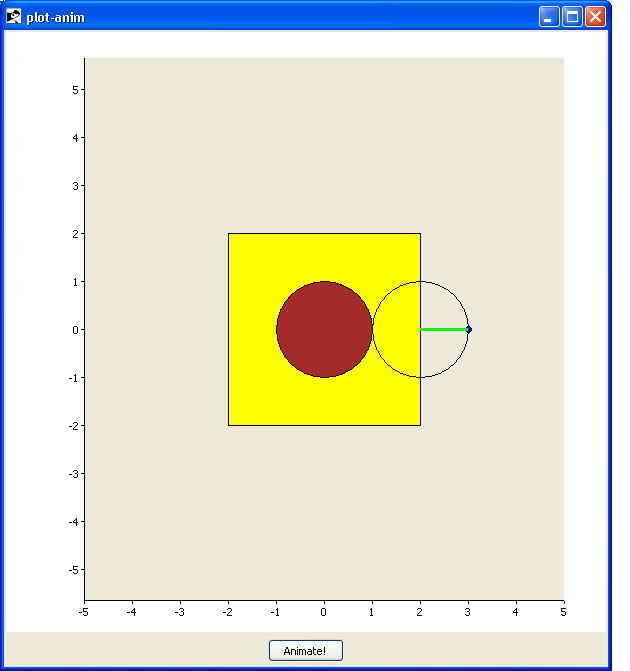
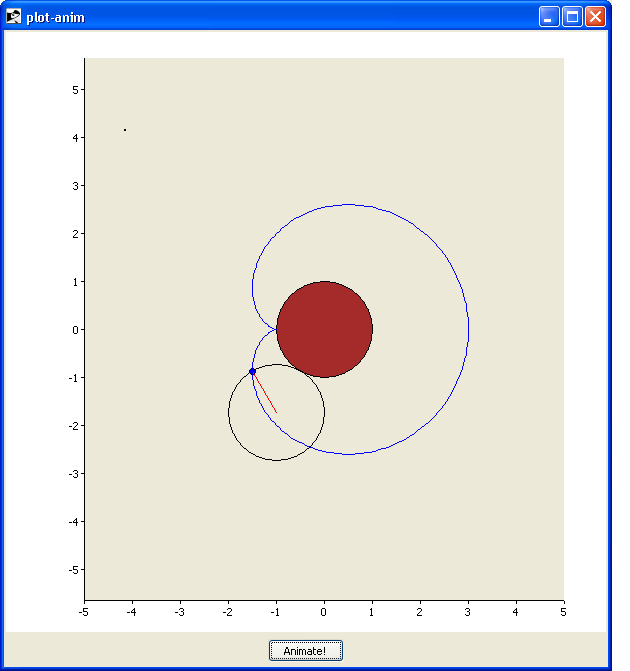
Constructing a cardioid (this is actually an animated chart):
You can see the animation here: [L1 ]. It runs, however, a little slower as on my computer, maybe the recording software is to blame.
And another animation: bugs on your screen ... or call them bubbles if you like, just randomly crawling towards the upper right corner of the plot. See the animation here: [L2 ]. Again, the video seems to record in slow motion, the bugs are a little quicker in reality.

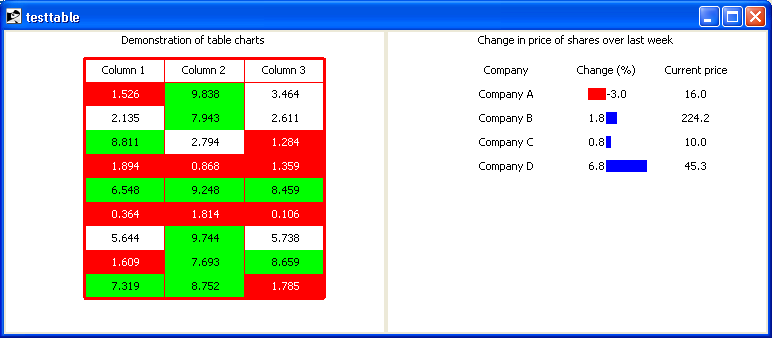
A new type of chart: tables. With the code below you can create all manner of tables. Ordinarily the cells in the table will be filled in with text, formatted and coloured according to the global settings, but it is also possible to change that via the formatting procedure. This is how the colours in the left table are drawn and the bars in the right one.
package require Plotchart 2.0

pack [canvas .c  -bg white -height 300] \
     [canvas .c2 -bg white -height 300] \
         -side left -fill both -expand yes

::Plotchart::plotconfig table frame outerwidth 3
::Plotchart::plotconfig table frame color red

set t [::Plotchart::createTableChart .c {"Column 1" "Column 2" "Column 3"} 80]

proc setColor {table widget row col value} {
    $table cellconfigure -background white -color black
    if { $value < 2.0 } {
        $table cellconfigure -background red -color white
    }
    if { $value > 6.0 } {
        $table cellconfigure -background green
    }

    return [format "%6.3f" $value]
}

# Command must already exist ...
$t formatcommand setColor

$t title "Demonstration of table charts"
$t separator

for {set i 0} {$i < 9} {incr i} {
    set row {}

    for {set j 0} {$j < 3} {incr j} {
        lappend row [expr {10.0 * rand()}]
    }

    if { $i == 3 } {
        $t separator
    }

    $t row $row
}

#
# Second type of table
#
::Plotchart::plotconfig table frame color {}

set t2 [::Plotchart::createTableChart .c2 {"Company" "Change (%)" "Current price"} {80 120 30}]

proc fillCell {table widget row col value} {
    if { $col != 1 } {
        return $value
    } else {
        $table worldcoordinates -10.0 -0.5 10.0 1.5
        if { $value < 0.0 } {
            foreach {xp1 yp1 xp2 yp2} [$table topixels $value 0.0 0.0 1.0] {break}
            $widget create rectangle $xp1 $yp1 $xp2 $yp2 -fill red -outline {}

            foreach {xp1 yp1} [$table topixels 0.2 0.0] {break}
            $widget create text $xp1 $yp1 -text $value -anchor sw

        } else {
            foreach {xp1 yp1 xp2 yp2} [$table topixels $value 0.0 0.0 1.0] {break}
            $widget create rectangle $xp1 $yp1 $xp2 $yp2 -fill blue -outline {}

            foreach {xp1 yp1} [$table topixels -0.2 0.0] {break}
            $widget create text $xp1 $yp1 -text $value -anchor se
        }
    }
    return {}
}

$t2 formatcommand fillCell
$t2 title "Change in price of shares over last week"

$t2 row {"Company A" -3.0  16.0}
$t2 row {"Company B"  1.8 224.2}
$t2 row {"Company C"  0.8  10.0}
$t2 row {"Company D"  6.8  45.3}
The resulting picture: