Version 0 of Shuffle a list: graph results
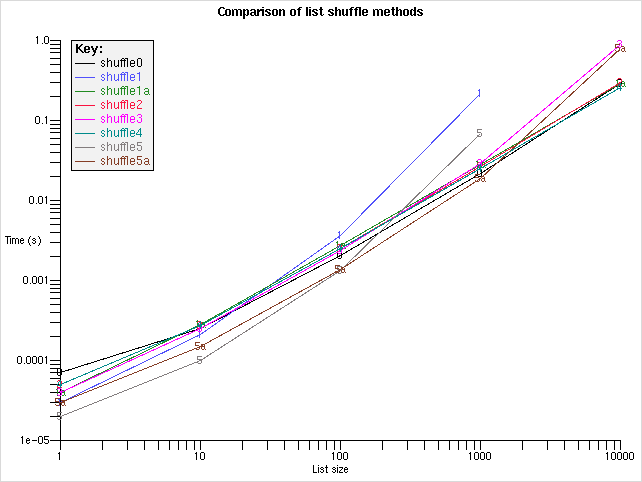
Updated 2001-04-03 09:02:51This graph shows the results of a tradeoff study on different procedures to shuffle a list into random sequence. The abscissa shows the length of the list, and the ordinate the time taken (on a 550 MHz PIII) to shuffle it. The curves correspond to the shuffle0, shuffle1, shuffle1a, shuffle2, shuffle3 and shuffle4 procedures, all of which appear on the page entitled Shuffle a list.
Please look below the image for the code that generated it. Thanks to DKF for making the image available!
(NOTE: The image is missing the curves for [shuffle5] and [shuffle5a].)

  # Graph the results of a tradeoff study on list shuffle procedures

  grid [canvas .c -width 640 -height 480 -bg white]

  array set color {
      0  black
      1  blue
      1a forestgreen
      2  red
      3  magenta
      4  darkcyan
      5  gray50
      5a brown
  }

  set yscale [expr { 400 / ( log( 1000000 ) - log ( 10 ) ) }]
  set xscale [expr { 560 / ( log( 10000 ) - log ( 1 ) ) }]

  .c create line 60 440 620 440
  .c create line 60 440 60 40
  for { set n 1 } { $n <= 10000 } { set n [expr { $n * 10 }] } {
      set x [expr { 60 + $xscale * log ( $n ) }]
      .c create text $x 450 -text $n -anchor n -font {Helvetica -10}
      for { set nn $n } { $nn < 10*$n && $nn <= 10000 } { incr nn $n } {
          set x [expr { 60 + $xscale * log ( $nn ) }]
          .c create line $x 440 $x 450
      }
  }
  for { set t 10 } { $t <= 1000000 } { set t [expr { $t * 10 }] } {
      set y [expr { 440 - $yscale * log ($t / 10) }]
      .c create text 50 $y -text [expr { 0.000001 * $t}] -anchor e \
              -font {Helvetica -10}
      for { set tt $t } { $tt < 10*$t && $tt <= 1000000 } { incr tt $t } {
          set y [expr { 440 - $yscale * log ($tt / 10) }]
          .c create line 60 $y 50 $y
      }
  }
  # default font is {Helvetica -12}
  .c create text 320 5 -text "Comparison of list shuffle methods" -anchor n \
          -font {Helvetica -12 bold}
  .c create text 330 475 -text "List size" -anchor s -font {Helvetica -10}
  .c create text 5 240 -text "Time (s)" -anchor w -font {Helvetica -10}

  set y0 42
  set dy [font metrics {Helvetica -12} -linespace]
  .c create text 75 $y0 -anchor nw -text "Key:" -fill black -tag key \
          -font {Helvetica -12 bold}
  incr y0 $dy
  foreach { method tm(1) tm(10) tm(100) tm(1000) tm(10000) } {
      shuffle0      78     253    2053   21730  287400
      shuffle1      37     212    3675  215110  ------
      shuffle1a     47     287    2754   28140  286400
      shuffle2      58     271    2513   26240  301400
      shuffle3      47     252    2363   29140  890200
      shuffle4      50     274    2504   25240  256300
      shuffle5      28     104    1342   68800  ------
      shuffle5a     33     153    1382   18830  785100
  } {
      set ab [string range $method 7 end]
      set y1 [expr {$y0+$dy/2}]
      .c create line 75 $y1 95 $y1  -fill $color($ab)  -tag key
      .c create text 100 $y0  -anchor nw  -text $method  -fill $color($ab) \
              -tag key
      incr y0 $dy
      foreach n { 1 10 100 1000 10000 } {
          set t $tm($n)
          if { [string compare ------ $t] } {
              set x [expr { 60 + $xscale * log ( $n ) }]
              set y [expr { 440 - $yscale * log ($t / 10) }]
              .c create text $x $y  -text $ab  -anchor center \
                      -fill $color($ab)  -font {Helvetica -10}
              if { [info exists lastx($ab)] } {
                  .c create line $lastx($ab) $lasty($ab) $x $y \
                          -fill $color($ab)
              }
              set lastx($ab) $x
              set lasty($ab) $y
          }
      }
  }
  foreach {x1 y1 x2 y2} [.c bbox key] {}
  .c create rectangle [incr x1 -2] [incr y1 -2] [incr x2 2] [incr y2 2] \
          -fill grey95  -outline black  -tags {key keybg}
  .c lower keybg

  if {[tk_messageBox -type yesno  -title "Snapshot?"  -icon question \
          -message "Take snapshot of graph?"] == "yes"} {
      # Need *two* updates
      update
      update
      # DKF - And Now a little code to convert this graph to a GIF
      # image file.  Obviously, this doesn't work everywhere and the
      # filename is hardcoded...
      exec xwd -id [winfo id .c] | xwdtopnm 2>@stderr | \
              ppmtogif >shufflegraph.gif 2>@stderr
      exit
  }
Needs a legend. What the heck do those different curves represent? Sheesh, this page has no explanation or introduction at the top. What kind of crap is that?
DKF - Well, ?, you might have just checked the page that references this one, as the explanation might be there for all to see. (All I did was link a representation of the output of the script into this page; I am otherwise not responsible for this stuff...)
KBK - Didn't imagine that someone would jump straight into this page. Oh, well, we all know that everything on the Web is out of context all the time.
DKF - Adjusted the page to include the code used to generate the image, and removed the picture from the bottom of the page since the top is a much better location...
DKF - Added a key and improved the font choices. Rebuilt displayed graph too.