A 'PlotQuik' Bar Chart GUI ... for making bar charts QUICKLY
uniquename - 2013jul25
Near the bottom of my uniquename page, I made a commitment to donating five 'PlotQuik' utilities to this Tcl-Tk wiki. Donating them requires 'extracting' the Tk scripts from the 'feHandyTools' subsystem of my free, open-source Freedom Environment software, that is available at www.freedomenv.com [L1 ].
The Tk code in the 'feHandyTools' system is written to use Tk 'include' files of common code. The 'include' code is merged into various Tk scripts via Tk 'source' statements.
In order to have 'stand-alone' scripts that I can donate here, I needed to merge some statements from those Tk-code 'include' files into the 'PlotQuik' Tk scripts.
I have done that for the 'pie chart' PlotQuik GUI and the code is on the wiki page A 'PlotQuik' Pie Chart GUI ... for making pie charts QUICKLY.
Like with the pie chart GUI, in the process of doing the merge and changing some comments in the code for the bar chart GUI, I made some improvements in the script --- actually MANY improvements. --- especially in regard to allowing more options for labeling along the x-axis, and in regard to positioning the bar chart between a top title line and an optional 'legend' below the plot.
So this code donation is actually quite a bit better than the 'PlotQuik' bar-chart-making Tk script in the current version of 'feHandyTools'.
Note that, like the pie-chart GUI, this bar-chart utility is 'Quik' in two ways:
1) Easy for the user to enter the data for the plot.
2) Once the data is entered, the plot is rendered in a fraction of a second.
Here is a reduced-size image of the bar chart GUI.
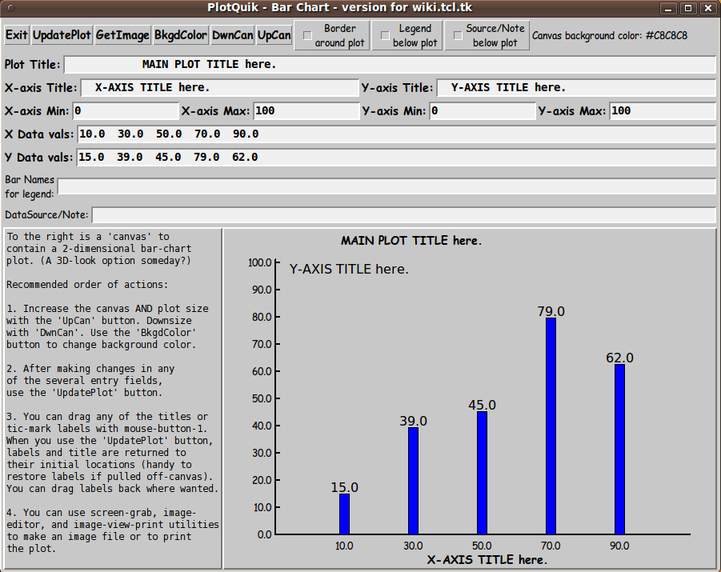
A full-size image of the GUI is available at this link [L2 ].
This GUI is not meant to be a toy. It is meant to be an actual 'productivity' tool --- a free and open-source one --- for quick and moderately-dirty, basic bar chart plots.
On the page for the pie-chart GUI script, I mentioned that I might add a 'GetImage' button to the GUI so that one can add decorative images (such as a logo) to a plot.
For this bar-chart GUI, I have done that, as you can see by this screenshot showing an image that was fetched via the 'GetImage' button on the GUI. The image is loaded into the lower right corner of the GUI. The user can then drag the image to wherever desired on (or even off) the plot canvas. Note that I dragged the image to the upper right of the plot area. (I clicked on the 'UpdatePlot' button to cause the plot to be redone over the image, so that the bar on the right was not partially hidden by the image.)
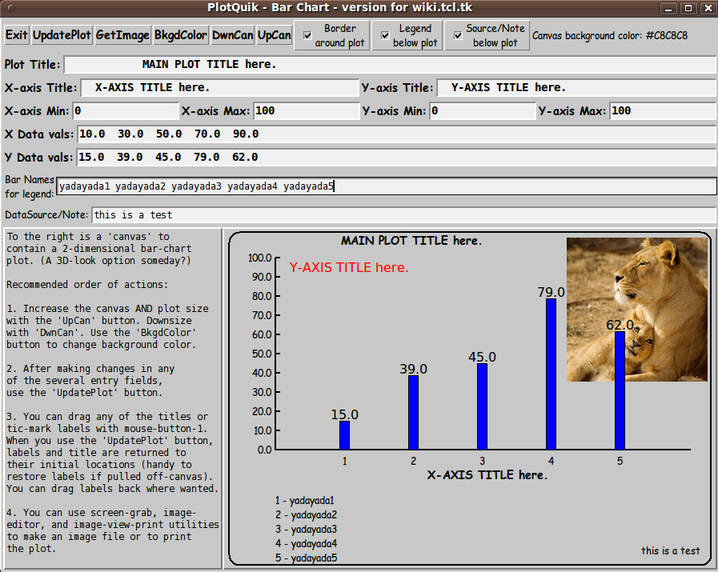
A full-size image of this screenshot is available at this link [L3 ].
Note that the y-axis title is in red. All the moveable text items on the GUI turn red when you run the pointer cursor over them.
Besides the image, all the text items that you see on this GUI are moveable. That includes main-title, axis-titles, axis-tic-labels, data-numbers, legend lines, and the data-source/note text line.
_____________________________________________________________________
Below is the code that produced this GUI.
There are comments above the sample code, in a section titled 'OUTPUT:', that describe how one could capture and make use of images produced by this GUI.
I follow my usual 'canonical' structure for Tk code, for this Tk script:
  0) Set general window & widget parms (win-name, win-position,
     win-color-scheme, fonts, widget-geometry-parms, win-size-control).

  1a) Define ALL frames and sub-frames.
  1b) Pack   ALL frames and sub-frames.

  2) Define & pack all widgets in the frames.

  3) Define keyboard or mouse/touchpad/touch-sensitive-screen
     action BINDINGS, if needed.

  4) Define PROCS, if needed.

  5) Additional GUI initialization (typically with one or more of
     the procs), if needed.
This structure is discussed in more detail on the page A Canonical Structure for Tk Code --- and variations.
This structure makes it easy for me to find code sections --- while generating and testing a Tk script, and when looking for code snippets to include in Tk scripts.
_________________________________________________________________
As in all my scripts that use the 'pack' geometry manager (which is all of my 100-plus Tk scripts, so far), I provide the four main pack parameters --- '-side', '-anchor', '-fill', and '-expand' --- on all the 'pack' commands for the frames and widgets.
I think I have found a good setting of the '-side', '-anchor', '-fill', and '-expand' parameters on the 'pack' commands for the various widgets of this GUI. In particular ...
The 'canvas' widget expands/contracts appropriately when the window size is changed --- and button and label widgets stay fixed in size and relative-location as the window size is changed. Entry fields x-expand if the window x-expands.
Note that there are 'UpCan' and 'DwnCan' buttons on the GUI to help re-size the canvas by increasing or decreasing the window size.
If anyone wants to change the way the GUI configures itself as the main window size is changed, they can experiment with the '-side', '-anchor', '-fill', and '-expand' parameters on the 'pack' commands for the various widgets --- to get the widget behavior that they want.
Also, you could change the fonts used for the various GUI widgets and plot elements (titles, data-text, legend-lines, etc.). For example, you could change '-weight' from 'bold' to 'normal' --- or '-slant' from 'roman' to 'italic'. Or change font families.
In fact, you may NEED to change the font families, because the families I used may not be available on your computer --- and the default font that the 'wish' interpreter chooses may not be very pleasing.
Furthermore, there are variables used to set geometry parameters of widgets --- parameters such as border-widths and padding. Feel free to experiment with those parameters as well.
___
Note that the 'BkgdColor' button calls on a color-selector-GUI script to set the canvas background color. You can make that color-selector script by cutting-and-pasting the code from the page A non-obfuscated color selector GUI on this site.
When you want to make a printed copy of a screen image, to save on ink, you will probably want to make the background of the plot canvas pure white (255,255,255 or #FFFFFF).
____________________________________________________________________
That said, here's the code --- with plenty of comments to describe what most of the code-sections are doing.
The main plotting code is in the proc 'update_plot'.
The copious comments in the code might help Tcl-Tk coding 'newbies' get started in making GUI's like this. Without the comments (especially in the 'update_plot' proc), the code might look too cryptic --- and potential young Tcler's might be tempted to return to their iPhones and iPads and iPods --- to watch the latest goings-on with England's royal family.
Code for script 'plot_quik_xy_bars_forWiki.tk' :
#!/usr/bin/wish
##
##+########################################################################
## Linux/Unix NOTE:
## If the 'wish' interpreter is in a different directory, such as
## /usr/local/bin, you can make a soft-link from 'wish' there to
## /usr/bin/wish, as root, with a command like
## ln -s /usr/local/bin/wish /usr/bin/wish
##+########################################################################
## Tk SCRIPT NAME: plot_quik_xy_bars_forWiki.tk
##
## --- adapted from the script 'plot_quik_xy_bars.tk'
## in the 'feHandyTools' subsystem of the 'Freedom Environment'
## subsystems at www.freedomenv.com --- adapted for donation
## of the code to the Tcl-Tk wiki at wiki.tcl.tk.
##
##+#######################################################################
## PURPOSE: An intuitive, easy-to-use X-Y-AXIS BARCHART PLOT UTILITY
## to make 'presentation quality' plots QUICKLY --- plots that
## are suitable to include in web pages and emails.
## _____________________________________________________________
##
## This Tk script presents a GUI with a canvas widget showing
## a barchart plot --- with titles and labels that can be
## dragged with the mouse.
##
## This script presents entry fields in the GUI to prompt for
## x,y data and titles and axis labels and limits.
## _____________________________________________________________
##
## This is a plotting-utility implementation using BASIC
## Tcl-Tk commands, i.e. not requiring an 'extension' of Tcl or Tk.
##
## Unfortunately, there do not seem to be any FAIRLY GENERAL, yet
## RELATIVELY SIMPLE, bar chart plotting scripts at Tcl-Tk archive
## sites --- even in 2013, more than 20 years after the development
## of the necessary Tk canvas facilities to support plotting.
##
## Nor are such general, easy-to-use bar chart plotting Tk scripts
## available via web searches on keyword strings such as
## 'bin wish canvas' or 'bin wish rect'.
##
## Even searches on 'canvas' and 'rect' on the wiki.tcl.tk site,
## in early 2013, yield only simplistic line plot 'demos' that are
## not suited to general and FAST bar chart plots --- with entry
## fields for quick entry of user data.
##
## This script is meant to fill that long-time void.
## _____________________________________________________________
##
## SOURCES and CREDITS:
##
## The technique of dragging canvas items came from the Tcl-Tk demo in
## /usr/local/lib/tk4.0/demos/plot.tcl (on SGI-IRIX Unix, 1995).
## However, that script allowed the user to drag the data points.
## This script allows the user to drag titles and labels.
##
## On Linux (for example, Ubuntu 9.10, circa 2009), see
## /usr/share/doc/tk8.4/examples/plot.tcl
## or /usr/share/doc/tk8.5/examples/plot.tcl
## There are 60-plus other Tcl-Tk code examples in the
## 'examples' directory.
##
## See also 'create oval' plot scripts like
## 'items.tcl' and 'twind.tcl' in /usr/share/doc/tk8.x/examples/.
## These scripts provide examples of procs to move 'items' around
## on the canvas with a mouse.
##
##+#####################################################################
##
## INPUTS (via entry fields on the GUI):
## plot title, axis-labels, axis min-max, xy data-points.
##
## OUTPUT: Intended for screen/window capture to an image file with a
## screen-capture tool (such as 'gnome-screenshot' on Linux).
##
## The image could be cropped with an image editor (such as
## 'mtpaint' on Linux) and the cropped image could be printed
## using an image view-print utility (such as 'eog' = Eye of
## Gnome, on Linux).
##
## If you are going to print the image, you will probably
## want to change the background color to white, via the
## 'BkgndColor' button at the top of the GUI.
##
## (Optionally, a Postscript-Print button and proc
## could be implemented --- sample code commented below.)
##
##+#####################################################################
## STRUCTURE OF THIS CODE:
##
## 0) Set general window parms (win-name, win-position, color-scheme,
## fonts, widget-geom-parms, win-size-control, text-array-for-labels-etc).
## 1a) Define ALL frames (and sub-frames, if any).
## 1b) Pack ALL frames and sub-frames.
## 2) Define & pack ALL widgets within frames, frame by frame ---
## typically going top-to-bottom and/or left-to-right, frame by frame.
##
## After ALL widgets are defined for a frame,
## pack the widgets in the frame..
##
## 3) Define key and mouse/touchpad/touch-sensitive-screen 'event'
## BINDINGS, if any.
## 4) Define PROCS, if any.
## 5) Additional GUI INITIALIZATION (typically with one or two
## of the procs), if needed.
##
## In more detail for this particular script:
##
## 1a) Define ALL frames: From the top down on the GUI are several horizontal
## frames stretching across the GUI --- 'fRbuttons' and several
## entry-widget frames for plot title, axis titles, axis limits, and
## xy data values, bar/legend labels.
##
## Below those stacked frames, across the GUI, is a container
## frame: 'fRplot'. There are 2 sub-frames on the left and right of
## the 'fRplot' frame: 'fRplot.fRmsg' and 'fRplot.fRcanvas'. Help text
## is in the 'fRmsg' frame and the plot is in the 'fRcanvas' frame.
##
## 1b) Pack frames with appropriate '-side' '-anchor' '-fill' '-expand'
## parameters to get proper behavior of widgets within the frames,
## during window expansion. (Window expansion is allowed.)
##
## 2) Define & pack all widgets in the frames -- basically going through
## frames & their interiors in top-to-bottom, left-to-right order:
##
## - 'fRbuttons' contains buttons --
## Exit, UpdatePlot, etc. buttons.
##
## - 'fRtitle_main' contains 1 label & 1 entry widget.
## - 'fRaxistitles' contains 2 label & 2 entry widget.
## - 'fRaxislims' contains 4 label & 4 entry widgets.
## - 'fRvals_x' contains 1 label & 1 entry widget.
## - 'fRvals_y' contains 1 label & 1 entry widget.
## - 'fRbarnames' contains 1 label & 1 entry widget (for a legend
## --- a stack of these names below the plot).
## - 'fRsource' contains 1 label & 1 entry widget
## to provide data-source info.
##
## - 'fRplot.fRmsg' contains a message in a label (or message or text)
## widget on the left side of the 'fRplot' frame.
##
## - 'fRplot.fRcanvas' contains a canvas widget (to be populated with
## 'items' whenever the 'UpdatePlot' button in 'fRbuttons'
## is poked), on the right side of the 'fRplot' frame.
##
## 3) Define bindings: (See Bindings code section.)
##
## To Drag plot-title and axis-titles (and tic-mark labels).
## Basically:
## - .c bind TAGmoveable <ButtonPress-1> "itemSelect .c %x %y"
## - bind .c <B1-Motion> "itemMove .c %x %y"
## - .c bind TAGmoveable <ButtonRelease-1> ".c dtag TAGselected"
##
## To Change color of titles (and tic-mark labels) during move.
## (Implement?)
## Basically:
## .c bind TAGtext <Any-Enter> ".c itemconfig current -fill <color1>"
## .c bind TAGtext <Any-Leave> ".c itemconfig current -fill <color2>"
##
## 4) Define procs: (See Procs code section.)
## - 'itemSelect' - To select canvas items
## - 'itemMove' - To move canvas items
##
## - 'set_margins' - To set margins around the 'plot rectangle'
## - 'update_plot' - for 'UpdatePlot' button;
## (Re)Sets contents of canvas widget!!
## - 'getset_bkgdcolor' - for 'BkgdColor' button
##
## - 'popup_msgVarWithScroll' - for pop up a msg whenever needed
## - 'resize_win' - for use by 'downsize_canvas' proc
## - 'downsize_canvas' - for 'DwnCan' button
## - 'upsize_canvas' - for 'UpCan' button
##
## - 'draw_border' - for a border yes/no checkbutton
## - 'get_image' - for 'GetImage' button
##
## procs NOT used yet (example code):
## - 'print_plot' - for 'Print' button
## - 'print_preview' - for 'PrtPreview' button
##
## 5) Additional GUI initialization: set some initial data and
## call 'update_plot' to present an
## intitial demo plot on the canvas
##
##+#######################################################################
## DEVELOPED WITH: Tcl-Tk 8.5 on Ubuntu 9.10 (2009-october, 'Karmic Koala')
##
## $ wish
## % puts "$tcl_version $tk_version"
##
## showed
## 8.5 8.5
## but this script should work in most previous 8.x versions, and probably
## even in some 7.x versions (if font handling is made 'old-style').
##+########################################################################
## MAINTENANCE HISTORY:
## Started by: Blaise Montandon 2013jul19 Started development, on Ubuntu 9.10,
## based on my code
## 'plot_quik_xy_bars.tk'
## in the 'feHandyTools' subsystem of
## the 'Freedom Environment' subsystems
## at www.freedomenv.com --- adapted for
## donation of this code to the Tcl-Tk
## wiki at wiki.tcl.tk.
## Updated by: ...... ......... 2013
##+########################################################################
##+#######################################################################
## Set general window parms (win-title, win-position).
##+#######################################################################
wm title . "PlotQuik - Bar Chart - version for wiki.tcl.tk"
wm iconname . "PlotBars"
wm geometry . +15+30
##+#######################################################################
## SET COLOR SCHEME (palette) for the window and its widgets ---
## and set the color for the canvas background.
##+#######################################################################
set r255 200
set g255 200
set b255 200
## If env vars R255,G255,B255 were set, then we could use the following
## format statement to get a hex value for specifying tkGUI colors,
## after 'catch'-ing the three values into r255,g255,b255 Tcl vars.
# catch { set r255 "$env(R255)" }
# catch { set g255 "$env(G255)" }
# catch { set b255 "$env(B255)" }
set COLOR_hex [format "#%02X%02X%02X" $r255 $g255 $b255]
## Or could set palette from a hex-valued env var.
# catch { set COLOR_hex "$env(FE_PLOT_WINCOLOR)" }
tk_setPalette "$COLOR_hex"
## Set colors for GUI widgets.
set entryBKGD "#f0f0f0"
##+#######################################################################
## SET COLORS (& other attributes, like line width) FOR CANVAS ITEMS.
## 'reg' = regular ; 'sel' = selected
##+#######################################################################
# set titlesCOLORreg black
set titlesCOLORreg #000000
## In case we want to temporarily change the color of text items as the
## user moves them on the canvas:
# set titlesCOLORsel red
set titlesCOLORsel #FF0000
## Set these in the proc 'update_plot'.
## We could eventually add widgets to the GUI so that the user
## can select values for these parameters.
# set COLOR_bars #FF0000
# set HALFWIDTH_bars 3
# set WIDTH_bar_outline 2
##+#######################################################################
## We use a VARIABLE-WIDTH FONT for label and button widgets.
##
## We use a FIXED-WIDTH FONT for listboxes and entry fields
## and text widgets, if any.
##+#######################################################################
set FONTsize 14
set FONT_SMALLsize 12
set FONTparms_varwidth " -family {comic sans ms} \
-size -$FONTsize -weight bold -slant roman"
set FONTparms_SMALL_varwidth " -family {comic sans ms} \
-size -$FONT_SMALLsize -weight normal -slant roman "
## Some other possible (similar) variable width fonts:
## Arial
## Bitstream Vera Sans
## DejaVu Sans
## Droid Sans
## FreeSans
## Liberation Sans
## Nimbus Sans L
## Trebuchet MS
## Verdana
set FONTparms_fixedwidth " -family {dejavu sans mono} \
-size -$FONTsize -weight bold -slant roman "
set FONTparms_SMALL_fixedwidth " -family {dejavu sans mono} \
-size -$FONT_SMALLsize -weight normal -slant roman "
## Some other possible fixed width fonts (esp. on Linux):
## Andale Mono
## Bitstream Vera Sans Mono
## Courier 10 Pitch
## Liberation Mono
## Droid Sans Mono
## FreeMono
## Nimbus Mono L
## TlwgMono
##+#####################################################################
## DEFINE (temporary) FONT VARS to be used in '-font' widget specs below
## --- and for some plot titles.
##+#####################################################################
eval font create fontTEMP_button $FONTparms_varwidth
eval font create fontTEMP_label $FONTparms_varwidth
eval font create fontTEMP_entry $FONTparms_fixedwidth
eval font create fontTEMP_listbox $FONTparms_fixedwidth
eval font create fontTEMP_msg $FONTparms_fixedwidth
eval font create fontTEMP_text $FONTparms_fixedwidth
eval font create fontTEMP_SMALL_button $FONTparms_SMALL_varwidth
eval font create fontTEMP_SMALL_label $FONTparms_SMALL_varwidth
eval font create fontTEMP_SMALL_entry $FONTparms_SMALL_fixedwidth
eval font create fontTEMP_SMALL_listbox $FONTparms_SMALL_fixedwidth
eval font create fontTEMP_SMALL_msg $FONTparms_SMALL_fixedwidth
eval font create fontTEMP_SMALL_text $FONTparms_SMALL_fixedwidth
## For the text in the plot:
eval font create fontTEMP_plottitle $FONTparms_varwidth
eval font create fontTEMP_axistitle $FONTparms_varwidth
eval font create fontTEMP_ticlabel $FONTparms_SMALL_varwidth
eval font create fontTEMP_legend $FONTparms_SMALL_varwidth
eval font create fontTEMP_source $FONTparms_SMALL_varwidth
##+#######################################################################
## SET GEOM VARS FOR THE VARIOUS WIDGET DEFINITIONS.
## (e.g. padx, pady for Buttons)
##+#######################################################################
## Set internal PADDING (X and Y) for BUTTON widgets.
set fePADY_button 0
set fePADX_button 0
## Set BORDER-WIDTH for LABEL, BUTTON, ENTRY, LISTBOX,
## TEXT, and MESSAGE widgets.
set feBDwidth_label 2
set feBDwidth_button 2
set feBDwidth_entry 2
set feBDwidth_listbox 2
set feBDwidth_text 2
set feBDwidth_msg 2
##+###################################################################
## Set a MINSIZE of the window (roughly).
##
## For WIDTH, allow for the minwidth of the '.fRbuttons' frame:
## about 4 widgets --- Exit etc. buttons.
##
## For HEIGHT, allow
## about 1 char high for the '.fRbuttons' frame and entry frames
## below that frame,
## about 24 pixels high for the '.fRplot' frame.
##+###################################################################
set minWinWidthPx [font measure fontTEMP_varwidth \
"Exit UpdatePlot GetImage BkgdColor DwnCan UpCan DrawBorder"]
## Add some pixels to account for right-left-side window decoration
## (about 8 pixels), about 6 x 4 pixels/widget for borders/padding for
## at least 6 button widgets.
set minWinWidthPx [expr {32 + $minWinWidthPx}]
## MIN HEIGHT ---
## for the 9 stacked frames allow
## 1 char high for 'fRbuttons'
## 1 char high for 'fRtitle_main'
## 1 char high for 'fRaxistitles'
## 1 char high for 'fRaxislims'
## 1 char high for 'fRvals_x'
## 1 char high for 'fRvals_y'
## 1 char high for 'fRbarnames'
## 1 char high for 'fRsource'
## 24 pixels high for 'fRplot'.
set CharHeightPx [font metrics fontTEMP_varwidth -linespace]
set minWinHeightPx [expr {8 * $CharHeightPx}]
set minWinHeightPx [expr {$minWinHeightPx + 24}]
## Add about 28 pixels for top-bottom window decoration,
## about 9x4 pixels for each of the 9 stacked frames and their
## widgets (their borders/padding).
set minWinHeightPx [expr {$minWinHeightPx + 64}]
## FOR TESTING:
# puts "minWinWidthPx = $minWinWidthPx"
# puts "minWinHeightPx = $minWinHeightPx"
wm minsize . $minWinWidthPx $minWinHeightPx
## We allow the window to be resizable and we pack the canvas with
## '-fill both -expand 1' so that the canvas can be enlarged by enlarging
## the window.
## If you want to make the window un-resizable,
## you can use the following statement.
# wm resizable . 0 0
##+##############################################################
## Set a TEXT-ARRAY to hold text for buttons & labels on the GUI.
## NOTE: This can aid INTERNATIONALIZATION. This array can
## be set according to a nation/region parameter.
##+##############################################################
## if { "$VARlocale" == "en"}
## For '.fRbuttons' frame:
set aRtext(buttonEXIT) "Exit"
# set aRtext(buttonHELP) "Help"
# set aRtext(buttonPRINT) "Print"
# set aRtext(buttonPRTPREVIEW) "PrtPreview"
set aRtext(buttonUPDATE) "UpdatePlot"
set aRtext(buttonCOLOR) "BkgdColor"
set aRtext(buttonIMAGE) "GetImage"
set aRtext(buttonDWNCAN) "DwnCan"
set aRtext(buttonUPCAN) "UpCan"
set aRtext(chkbuttBORDER) "Border
around plot"
set aRtext(chkbuttLEGEND) "Legend
below plot"
set aRtext(chkbuttSOURCE) "Source/Note
below plot"
# set aRtext(chkbuttOUTLINES) "Outlines
# around bars"
set aRtext(labelCOLOR) "Canvas background color:"
## For '.fRtitle_main' frame:
set aRtext(labelPLOTTITLE) "Plot Title:"
## For '.fRaxistitles' frame:
set aRtext(labelXAXISTITLE) "X-axis Title:"
set aRtext(labelYAXISTITLE) "Y-axis Title:"
## For '.fRaxislims' frame:
set aRtext(labelXAXISMIN) "X-axis Min:"
set aRtext(labelXAXISMAX) "X-axis Max:"
set aRtext(labelYAXISMIN) "Y-axis Min:"
set aRtext(labelYAXISMAX) "Y-axis Max:"
## For '.fRvals_x' frame:
set aRtext(labelXVALS) "X Data vals:"
## For '.fRvals_y' frame:
set aRtext(labelYVALS) "Y Data vals:"
## For '.fRbarnames' frame:
set aRtext(labelBARNAMES) "Bar Names
for legend:"
## For '.fRsource' frame:
set aRtext(labelSOURCE) "DataSource/Note:"
## For '.fRplot.fRmsg' frame:
set aRtext(labelHELPMSG) "To the right is a 'canvas' to
contain a 2-dimensional bar-chart
plot. (A 3D-look option someday?)
Recommended order of actions:
1. Increase the canvas AND plot size
with the 'UpCan' button. Downsize
with 'DwnCan'. Use the 'BkgdColor'
button to change background color.
2. After making changes in any
of the several entry fields,
use the 'UpdatePlot' button.
3. You can drag any of the titles or
tic-mark labels with mouse-button-1.
When you use the 'UpdatePlot' button,
labels and title are returned to
their initial locations (handy to
restore labels if pulled off-canvas).
You can drag labels back where wanted.
4. You can use screen-grab, image-
editor, and image-view-print utilities
to make an image file or to print
the plot."
## END OF if { "$VARlocale" == "en"}
##+####################################################################
##+####################################################################
## DEFINE *ALL* THE FRAMES -- (top to bottom):
##
## - 'fRbuttons' contains buttons --
## Exit, UpdatePlot, etc. buttons.
##
## - 'fRtitle_main' contains 1 label & 1 entry widget.
## - 'fRaxistitles' contains 2 label & 2 entry widget.
## - 'fRaxislims' contains 4 label & 4 entry widgets.
## - 'fRvals_x' contains 1 label & 1 entry widget.
## - 'fRvals_y' contains 1 label & 1 entry widget.
## - 'fRbarnames' contains 1 label & 1 entry widget.
## - 'fRsource' contains 1 label & 1 entry widget.
##
## - '.fRplot.fRmsg' contains a message in a label (or message or
## text) widget.
##
## - '.fRplot.fRcanvas' contains a canvas widget.
##
##+####################################################################
## FOR TESTING: (how 'pack' sizes the frames)
# set feRELIEF_frame raised
# set feBDwidth_frame 2
set feRELIEF_frame flat
set feBDwidth_frame 2
frame .fRbuttons -relief $feRELIEF_frame -borderwidth $feBDwidth_frame
frame .fRtitle_main -relief $feRELIEF_frame -borderwidth $feBDwidth_frame
frame .fRaxistitles -relief $feRELIEF_frame -borderwidth $feBDwidth_frame
frame .fRaxislims -relief $feRELIEF_frame -borderwidth $feBDwidth_frame
frame .fRvals_x -relief $feRELIEF_frame -borderwidth $feBDwidth_frame
frame .fRvals_y -relief $feRELIEF_frame -borderwidth $feBDwidth_frame
frame .fRbarnames -relief $feRELIEF_frame -borderwidth $feBDwidth_frame
frame .fRsource -relief $feRELIEF_frame -borderwidth $feBDwidth_frame
frame .fRplot -relief $feRELIEF_frame -borderwidth $feBDwidth_frame
frame .fRplot.fRmsg -relief raised -borderwidth 2
frame .fRplot.fRcanvas -relief raised -borderwidth 2
##+########################################################
## PACK *ALL* the FRAMES.
##+########################################################
## PACK THE FRAMES IN SEPARATELY, in order to
## experiment with different behaviors in window expansion.
##+########################################################
pack .fRbuttons \
-side top \
-anchor w \
-fill none \
-expand 0
pack .fRtitle_main \
-side top \
-anchor w \
-fill x \
-expand 0
pack .fRaxistitles \
-side top \
-anchor w \
-fill x \
-expand 0
pack .fRaxislims \
-side top \
-anchor w \
-fill x \
-expand 0
pack .fRvals_x \
-side top \
-anchor w \
-fill x \
-expand 0
pack .fRvals_y \
-side top \
-anchor w \
-fill x \
-expand 0
pack .fRbarnames \
-side top \
-anchor w \
-fill x \
-expand 0
pack .fRsource \
-side top \
-anchor w \
-fill x \
-expand 0
pack .fRplot \
-side top \
-anchor center \
-fill both \
-expand 1
## Pack the sub-frames.
pack .fRplot.fRmsg \
-side left \
-anchor nw \
-fill y \
-expand 0
pack .fRplot.fRcanvas \
-side right \
-anchor ne \
-fill both \
-expand 1
##+################################################################
## Finished defining all the frames.
##+################################################################
## START DEFINING & PACKING WIDGETS WITHIN THEIR FRAMES.
##+################################################################
##+################################################################
##+########################################################
## IN THE 'fRbuttons' frame -- DEFINE 5 BUTTON WIDGETs.
## THEN PACK EM.
##+########################################################
button .fRbuttons.buttExit \
-text "$aRtext(buttonEXIT)" \
-font fontTEMP_button \
-padx $fePADX_button \
-pady $fePADY_button \
-command {exit}
## User could implement Help button someday.
# button .fRbuttons.buttHelp \
# -text "$aRtext(buttonHELP)" \
# -font fontTEMP_button \
# -padx $fePADX_button \
# -pady $fePADY_button \
# -command {popup_msgVarWithScroll .fRhelp "$HELPtext"}
## User could implement Print option someday.
# button .fRbuttons.buttPrint \
# -text "$aRtext(buttonPRINT)" \
# -font fontTEMP_button \
# -padx $fePADX_button \
# -pady $fePADY_button \
# -command {print_plot}
## User could implement Print-preview option someday.
# button .fRbuttons.buttPrtPreview \
# -text "$aRtext(buttonPRTPREVIEW)" \
# -font fontTEMP_button \
# -padx $fePADX_button \
# -pady $fePADY_button \
# -command {print_preview}
button .fRbuttons.buttUpdate \
-text "$aRtext(buttonUPDATE)" \
-font fontTEMP_button \
-padx $fePADX_button \
-pady $fePADY_button \
-command {update_plot}
button .fRbuttons.buttBkgdColor \
-text "$aRtext(buttonCOLOR)" \
-font fontTEMP_button \
-padx $fePADX_button \
-pady $fePADY_button \
-command {getset_bkgdcolor}
button .fRbuttons.buttImage \
-text "$aRtext(buttonIMAGE)" \
-font fontTEMP_button \
-padx $fePADX_button \
-pady $fePADY_button \
-text "GetImage" \
-command get_image
button .fRbuttons.buttDWNwin \
-text "$aRtext(buttonDWNCAN)" \
-font fontTEMP_button \
-padx $fePADX_button \
-pady $fePADY_button \
-command {downsize_canvas}
button .fRbuttons.buttUPwin \
-text "$aRtext(buttonUPCAN)" \
-font fontTEMP_button \
-padx $fePADX_button \
-pady $fePADY_button \
-command {upsize_canvas}
checkbutton .fRbuttons.chkbuttBorder \
-text "$aRtext(chkbuttBORDER)" \
-font fontTEMP_SMALL_button \
-variable border0or1 \
-padx $fePADX_button \
-pady $fePADY_button \
-selectcolor "#cccccc" \
-relief raised \
-padx 4px
checkbutton .fRbuttons.chkbuttLegend \
-text "$aRtext(chkbuttLEGEND)" \
-font fontTEMP_SMALL_button \
-variable legend0or1 \
-padx $fePADX_button \
-pady $fePADY_button \
-selectcolor "#cccccc" \
-relief raised \
-padx 4px
checkbutton .fRbuttons.chkbuttSource \
-text "$aRtext(chkbuttSOURCE)" \
-font fontTEMP_SMALL_button \
-variable source0or1 \
-padx $fePADX_button \
-pady $fePADY_button \
-selectcolor "#cccccc" \
-relief raised \
-padx 4px
# checkbutton .fRbuttons.chkbuttOutlines \
# -text "$aRtext(chkbuttOUTLINES)" \
# -font fontTEMP_SMALL_button \
# -variable outline0or1 \
# -padx $fePADX_button \
# -pady $fePADY_button \
# -selectcolor "#cccccc" \
# -relief flat \
# -padx 10px
label .fRbuttons.lab1 \
-text "$aRtext(labelCOLOR)" \
-font fontTEMP_SMALL_label \
-anchor w
label .fRbuttons.lab2 \
-text "$COLOR_hex" \
-font fontTEMP_SMALL_label \
-anchor w
## Pack the widgets in frame '.fRbuttons'.
pack .fRbuttons.buttExit \
.fRbuttons.buttUpdate \
.fRbuttons.buttImage \
.fRbuttons.buttBkgdColor \
.fRbuttons.buttDWNwin \
.fRbuttons.buttUPwin \
.fRbuttons.chkbuttBorder \
.fRbuttons.chkbuttLegend \
.fRbuttons.chkbuttSource \
.fRbuttons.lab1 \
.fRbuttons.lab2 \
-side left \
-anchor center \
-fill none \
-expand 1
# .fRbuttons.buttHelp \
# .fRbuttons.buttPrint \
# .fRbuttons.buttPrtPreview \
# .fRbuttons.chkbuttOutlines \
##+########################################################
## IN THE 'fRtitle_main' frame --
## DEFINE 1 LABEL & 1 ENTRY WIDGET. THEN PACK EM.
##+########################################################
label .fRtitle_main.lab1 \
-text "$aRtext(labelPLOTTITLE)" \
-font fontTEMP_label \
-anchor w
## We initialize this var at the bottom of this script,
## in the GUI inititalization section.
# set titleMain " MAIN PLOT TITLE here."
entry .fRtitle_main.ent1 \
-width 75 \
-font fontTEMP_entry \
-bg $entryBKGD \
-relief sunken \
-bd 2 \
-textvariable titleMain
pack .fRtitle_main.lab1 \
-side left \
-anchor w \
-fill none \
-expand 0
pack .fRtitle_main.ent1 \
-side left \
-anchor w \
-fill x \
-expand 1
##+########################################################
## IN THE 'fRaxistitles' frame --
## DEFINE 1 LABEL & 1 ENTRY WIDGET for x-axis, then y-axis.
## AND PACK the 4 widgets.
##+########################################################
label .fRaxistitles.xlab1 \
-text "$aRtext(labelXAXISTITLE)" \
-font fontTEMP_label \
-anchor w
## We initialize this var at the bottom of this script,
## in the GUI inititalization section.
# set titleXaxis " X-AXIS TITLE here."
entry .fRaxistitles.xent1 \
-width 40 \
-font fontTEMP_entry \
-bg $entryBKGD \
-relief sunken \
-bd 2 \
-textvariable titleXaxis
## Pack x-axis-title widgets in frame '.fRaxistitles'.
pack .fRaxistitles.xlab1 \
-side left \
-anchor w \
-fill none \
-expand 0
pack .fRaxistitles.xent1 \
-side left \
-anchor w \
-fill x \
-expand 1
##+########################################################
## Now, for the y-axis
## DEFINE 1 LABEL & 1 ENTRY WIDGET. THEN PACK EM.
##+########################################################
label .fRaxistitles.ylab1 \
-text "$aRtext(labelYAXISTITLE)" \
-font fontTEMP_label \
-anchor w
## We initialize this var at the bottom of this script,
## in the GUI inititalization section.
# set titleYaxis "Y-AXIS TITLE here. "
entry .fRaxistitles.yent1 \
-width 40 \
-font fontTEMP_entry \
-bg $entryBKGD \
-relief sunken \
-bd 2 \
-textvariable titleYaxis
## Pack y-axis-title widgets in frame '.fRaxistitles'.
pack .fRaxistitles.ylab1 \
-side left \
-anchor w \
-fill none \
-expand 0
pack .fRaxistitles.yent1 \
-side left \
-anchor w \
-fill x \
-expand 1
##+########################################################
## IN THE 'fRaxislims' frame --
## DEFINE 2 LABEL & 2 ENTRY WIDGETs for X-AXIS, then y-axis.
## AND PACK the 8 widgets.
##+########################################################
label .fRaxislims.labXmin \
-text "$aRtext(labelXAXISMIN)" \
-font fontTEMP_label \
-anchor w
## We initialize this var at the bottom of this script,
## in the GUI inititalization section.
# set Xmin "0"
# set Xmin "0.0" ; ## Causes tic-labels to go to 1-decimal format.
entry .fRaxislims.entXmin \
-width 15 \
-font fontTEMP_entry \
-bg $entryBKGD \
-relief sunken \
-bd 2 \
-textvariable Xmin
label .fRaxislims.labXmax \
-text "$aRtext(labelXAXISMAX)" \
-font fontTEMP_label \
-anchor w
## We initialize this var at the bottom of this script,
## in the GUI inititalization section.
# set Xmax "100"
# set Xmax "100.0" ; ## Causes tic-labels to go to 1-decimal format.
entry .fRaxislims.entXmax \
-width 15 \
-font fontTEMP_entry \
-bg $entryBKGD \
-relief sunken \
-bd 2 \
-textvariable Xmax
## Pack the Xmin, Xmax widgets in frame '.fRaxislims'.
pack .fRaxislims.labXmin \
-side left \
-anchor w \
-fill none \
-expand 0
pack .fRaxislims.entXmin \
-side left \
-anchor w \
-fill x \
-expand 1
pack .fRaxislims.labXmax \
-side left \
-anchor w \
-fill none \
-expand 0
pack .fRaxislims.entXmax \
-side left \
-anchor w \
-fill x \
-expand 1
##+########################################################
## IN THE 'fRaxislims' frame -- for the Y-AXIS
## DEFINE 2 LABEL & 2 ENTRY WIDGETs. THEN PACK EM.
##+########################################################
label .fRaxislims.labYmin \
-text "$aRtext(labelYAXISMIN)" \
-font fontTEMP_label \
-anchor w
## We initialize this var at the bottom of this script,
## in the GUI inititalization section.
# set Ymin "0"
# set Ymin "0.0" ; ## Causes tic-labels to go to 1-decimal format.
entry .fRaxislims.entYmin \
-width 15 \
-font fontTEMP_entry \
-bg $entryBKGD \
-relief sunken \
-bd 2 \
-textvariable Ymin
label .fRaxislims.labYmax \
-text "$aRtext(labelYAXISMAX)" \
-font fontTEMP_label \
-anchor w
## We initialize this var at the bottom of this script,
## in the GUI inititalization section.
# set Ymax "100"
# set Ymax "100.0" ; ## Causes tic-labels to go to 1-decimal format.
entry .fRaxislims.entYmax \
-width 15 \
-font fontTEMP_entry \
-bg $entryBKGD \
-relief sunken \
-bd 2 \
-textvariable Ymax
## Pack y-axis-lims widgets in frame '.fRaxislims'.
pack .fRaxislims.labYmin \
-side left \
-anchor w \
-fill none \
-expand 0
pack .fRaxislims.entYmin \
-side left \
-anchor w \
-fill x \
-expand 1
pack .fRaxislims.labYmax \
-side left \
-anchor w \
-fill none \
-expand 0
pack .fRaxislims.entYmax \
-side left \
-anchor w \
-fill x \
-expand 1
##+########################################################
## IN THE 'fRvals_x' frame --
## DEFINE 1 LABEL & 1 ENTRY WIDGETs. THEN PACK EM.
##+########################################################
label .fRvals_x.labXvals \
-text "$aRtext(labelXVALS)" \
-font fontTEMP_label \
-anchor w
## We initialize this var at the bottom of this script,
## in the GUI inititalization section.
# set Xvals "10.0 30.0 50.0 70.0 90.0"
entry .fRvals_x.entXvals \
-width 80 \
-font fontTEMP_entry \
-bg $entryBKGD \
-relief sunken \
-bd 2 \
-textvariable Xvals
## Pack the widgets in frame '.fRvals_x'.
pack .fRvals_x.labXvals \
-side left \
-anchor w \
-fill none \
-expand 0
pack .fRvals_x.entXvals \
-side left \
-anchor w \
-fill x \
-expand 1
##+########################################################
## IN THE 'fRvals_y' frame --
## DEFINE 1 LABEL & 1 ENTRY WIDGETs. THEN PACK EM.
##+########################################################
label .fRvals_y.labYvals \
-text "$aRtext(labelYVALS)" \
-font fontTEMP_label \
-anchor w
## We initialize this var at the bottom of this script,
## in the GUI inititalization section.
# set Yvals "10.0 30.0 50.0 70.0 90.0"
entry .fRvals_y.entYvals \
-width 80 \
-font fontTEMP_entry \
-bg $entryBKGD \
-relief sunken \
-bd 2 \
-textvariable Yvals
pack .fRvals_y.labYvals \
-side left \
-anchor w \
-fill none \
-expand 0
pack .fRvals_y.entYvals \
-side left \
-anchor w \
-fill x \
-expand 1
##+########################################################
## IN THE 'fRbarnames' frame --
## DEFINE 1 LABEL & 1 ENTRY WIDGETs. THEN PACK EM.
##+########################################################
label .fRbarnames.labBarnames \
-text "$aRtext(labelBARNAMES)" \
-font fontTEMP_SMALL_label \
-justify left \
-anchor w
## We initialize this var at the bottom of this script,
## in the GUI inititalization section. NOTE:
## If there are embedded spaces in a 'barname', the user
## should enclose the name in double-quotes.
# set VARbarnames "\"BMW sportscar\" Mercedes Lamborghini Lotus Yugo Smartcar Ford"
entry .fRbarnames.entBarnames \
-width 80 \
-font fontTEMP_SMALL_entry \
-bg $entryBKGD \
-relief sunken \
-bd 2 \
-textvariable VARbarnames
## Pack widgets in frame 'fRbarnames'.
pack .fRbarnames.labBarnames \
-side left \
-anchor w \
-fill none \
-expand 0
pack .fRbarnames.entBarnames \
-side left \
-anchor w \
-fill x \
-expand 1
##+########################################################
## IN THE 'fRsource' frame --
## DEFINE 1 LABEL & 1 ENTRY WIDGETs. THEN PACK EM.
##+########################################################
label .fRsource.labSource \
-text "$aRtext(labelSOURCE)" \
-font fontTEMP_SMALL_label \
-justify left \
-anchor w
## We initialize this var at the bottom of this script,
## in the GUI inititalization section. NOTE:
## If there are embedded spaces in a 'barname', the user
## should enclose the name in double-quotes.
# set VARbarnames "\"BMW sportscar\" Mercedes Lamborghini Lotus Yugo Smartcar Ford"
entry .fRsource.entSource \
-width 80 \
-font fontTEMP_SMALL_entry \
-bg $entryBKGD \
-relief sunken \
-bd 2 \
-textvariable VARsource
## Pack widgets in frame 'fRsource'.
pack .fRsource.labSource \
-side left \
-anchor w \
-fill none \
-expand 0
pack .fRsource.entSource \
-side left \
-anchor w \
-fill x \
-expand 1
##+########################################################
## IN THE 'fRplot.fRmsg' frame -- DEFINE 1 LABEL WIDGET.
## THEN PACK IT.
##+########################################################
label .fRplot.fRmsg.lab \
-text "$aRtext(labelHELPMSG)" \
-font fontTEMP_SMALL_msg \
-justify left \
-anchor nw
pack .fRplot.fRmsg.lab \
-side top \
-anchor nw \
-fill none \
-expand 0
##+########################################################
## IN THE 'fRplot.fRcanvas' frame -- DEFINE 1 CANVAS WIDGET.
## THEN PACK IT.
##
## We highlightthickness & borderwidth of the canvas to
## zero, as suggested on page 558, Chapter 37, 'The Canvas
## Widget', in the 4th edition of the book 'Practical
## Programming in Tcl and Tk'.
##+########################################################
## Instead of hard-coding an initial canvas size, like this
## set canWidthPx 500
## set canHeightPx 375
## we set the canvas size in proportion to the screen size.
set SCRNsizexPx [winfo screenwidth .]
set SCRNsizeyPx [winfo screenheight .]
set canWidthPx [ expr {int(6 * $SCRNsizexPx / 10)} ]
set canHeightPx [ expr {int(6 * $SCRNsizeyPx / 10)} ]
## FOR TESTING:
# puts "canWidth: $canWidthPx"
# puts "canHeight: $canHeightPx"
canvas .fRplot.fRcanvas.c \
-width $canWidthPx \
-height $canHeightPx \
-relief flat \
-highlightthickness 0 \
-borderwidth 0
pack .fRplot.fRcanvas.c \
-side top \
-anchor nw \
-fill both \
-expand 1
##+##################################################################
## Finished defining widgets in all the frames.
##+#######################################################################
##+#######################################################################
## END OF MAIN GUI BUILDING SECTION.
##+#######################################################################
##+#######################################################################
##+#######################################################################
##+#######################################################################
## DEFINE BINDINGS -- for mouse actions:
## - to Drag titles (main,x-axis,y-axis) as well as legend lines.
## - to Change color of titles during their move (Implement?)
## - button1-release binding on the Border (on/off) checkbutton,
## to perform the 'draw_border' proc.
##+#######################################################################
##+#######################################################################
##+#####################################
## To Drag titles (and tic-mark labels):
##+#####################################
## The tag 'TAGmoveable' limits the select-and-move
## operations to items that we want to make moveable
## on the canvas.
##+#################################################
.fRplot.fRcanvas.c bind TAGmoveable <ButtonPress-1> \
"itemSelect .fRplot.fRcanvas.c %x %y"
bind .fRplot.fRcanvas.c <B1-Motion> \
"itemMove .fRplot.fRcanvas.c %x %y"
## Remove the 'selected' tag when button is released.
.fRplot.fRcanvas.c bind TAGmoveable <ButtonRelease-1> \
".fRplot.fRcanvas.c dtag TAGselected"
##+################################################
## To Change color of text items during their move:
##+################################################
.fRplot.fRcanvas.c bind TAGtext <Any-Enter> \
".fRplot.fRcanvas.c itemconfig current -fill $titlesCOLORsel"
.fRplot.fRcanvas.c bind TAGtext <Any-Leave> \
".fRplot.fRcanvas.c itemconfig current -fill $titlesCOLORreg"
##+#############################################
## If the user clicks on the Border checkbutton,
## draw border around plot:
##+#############################################
bind .fRbuttons.chkbuttBorder <ButtonRelease-1> "draw_border"
##+#############################################
## If the user clicks on the Legend or Source
## checkbutton, update the plot.
##+#############################################
bind .fRbuttons.chkbuttLegend <ButtonRelease-1> "update_plot"
bind .fRbuttons.chkbuttSource <ButtonRelease-1> "update_plot"
##+#####################################################################
## End of bindings.
##+#####################################################################
##+#####################################################################
## DEFINE PROCEDURES:
##
## Main procs:
## - 'itemSelect' - selects a canvas item to move
## - 'itemMove' - moves a selected canvas item
##
## - 'set_margins' - sets margins around 'central plot rectangle';
## used in the 'update_plot' proc.
## - 'update_plot' - performs most of the plot
##
## - 'getset_bkgdcolor' - gets-sets bkgd color for canvas, via an
## external color-selector
##
## Other, utility procs:
## - 'resize_win' - increase/decrease GUI window size by a factor
## - 'downsize_canvas' - reduces the GUI/canvas size by a percentage
## - 'upsize_canvas' - increases the GUI/canvas size by a percentage
##
## - 'toggle_border' - puts a border around the plot
## - 'get_image' - gets and puts image on the canvas
##
## - 'popup_msgVarWithScroll' - used to popup msgs, such as help, to user
##
## - 'print_plot' (not used yet; sample, untested code)
## - 'print_preview' (not used yet; sample, untested code)
##
##+#####################################################################
##+#####################################################################
##+#####################################################################
## proc 'itemSelect'
##+#####################################################################
##
## PURPOSE:
## This procedure is invoked when the mouse is pressed over a
## canvas item. It sets up state to allow the item to be dragged.
##
## Arguments:
## w - The canvas window.
## x, y - The coordinates of the mouse press.
##
## CALLED BY: the binding
## .fRplot.fRcanvas.c bind TAGmoveable <ButtonPress-1>
##+#####################################################################
set lastXsel 0
set lastYsel 0
proc itemSelect {w x y} {
global lastXsel lastYsel
## Delete the tag 'TAGselected' from any 'TAGselected' items.
$w dtag TAGselected
## Add the tag 'TAGselected' to the currently selected item.
$w addtag TAGselected withtag current
$w raise current
set lastXsel $x
set lastYsel $y
}
## END of proc 'itemSelect'
##+#####################################################################
## proc 'itemMove'
##+#####################################################################
##
## PURPOSE:
## This procedure is invoked during mouse motion events.
## It drags the current item.
##
## Arguments:
## w - The canvas window.
## x, y - The coordinates of the mouse.
##
## CALLED BY: the binding
## .fRplot.fRcanvas.c <B1-Motion>
##+#####################################################################
proc itemMove {w x y} {
global lastXsel lastYsel
$w move TAGselected [expr {$x - $lastXsel}] [expr {$y - $lastYsel}]
set lastXsel $x
set lastYsel $y
}
## END of proc 'itemMove'
##+#####################################################################
## proc 'set_margins'
##+#####################################################################
##
## PURPOSE:
## SETS 4 MARGIN VARS that can be used to consistently set the
## limits of the 'plot rectangle' within the canvas widget.
## (Whenever the canvas is resized, these values can be
## used to resize the 'central' plot rectangle.)
##
## The 'plot rectangle', horizontally, starts at
## the left-end of the x-axis and goes to the right-end
## of the x-axis --- and, vertically, starts at one end
## of the y-axis and goes to the other end of the y-axis.
## I.e. this rectangle is the smallest rectangle containing
## the 'domain' of the x and y axes.
##
## The titles and axis labels generally lie outside this
## rectangle, so these 4 values should take those items into
## account. Hence the choice of fonts (set at top of script)
## can/should be used to set these 4 'margin values' (in pixels).
##
## Note that we set these margins in 'absolute' pixel units
## rather than as 'proportionality factors' to be applied
## to the canvas dimensions.
##
## These 4 'margin values' can be used to set variables that
## will be used to set the ending points of the plot axes
## within the plot canvas,
## say XMINpx,XMAXpx,YTOPpx,YBOTpx (in pixels).
##+########################################################
## Example use:
## set XMINpx $MARGNxminPx
## set XMAXpx [expr { $canWidthPx - $MARGNxmaxPx } ]
## set YTOPpx $MARGNytopPx
## set YBOTpx [expr { $canHeightPx - $MARGNybotPx }]
##+########################################################
## CALLED BY: proc 'update_plot'
##+########################################################
proc set_margins { Nlegend_lines } {
global MARGNxminPx MARGNxmaxPx MARGNytopPx MARGNybotPx
global CharHeightPx legend0or1 source0or1
## CharHeightPx is set where win minsize is set, at top of script.
## Set LEFT MARGIN.
set CharWidthPx [font measure fontTEMP_varwidth "W"]
set MARGNxminPx [expr {4 * $CharWidthPx}]
# set MARGNxminPx [expr {6 * $CharWidthPx}]
## Set RIGHT MARGIN.
set MARGNxmaxPx [expr {2 * $CharWidthPx}]
## Set TOP MARGIN.
set MARGNytopPx [expr {2 * $CharHeightPx}]
#################################################################
## SET BOTTOM MARGIN.
## For the bottom margin, allow a line for x-axis title
## and a line for x-axis labels --- and if a legend is requested,
## allow for legend lines, and if source-of-data is to be shown,
## add a line for that.
#################################################################
set Nlines 2
if {$legend0or1 == 1} {
set Nlines [expr {$Nlines + $Nlegend_lines}]
}
if {$source0or1 == 1} {
set Nlines [expr {$Nlines + 1}]
}
## Add a few pixels to allow some breathing room for x-axis
## labels and legend.
set MARGNybotPx [expr {($Nlines * $CharHeightPx) + 4}]
}
## END of proc 'set_margins'
##+#####################################################################
## proc 'update_plot' (for barchart plot)
##+#####################################################################
##
## PURPOSE:
## This procedure is invoked to (re)create the canvas items using the
## current GUI entries and the current canvas size.
## Uses 'create rect' to make the bars of the plot.
## Uses 'create line' to create axes and tic-marks.
## Uses 'create text' for titles and labels.
##
## Arguments: none
##
## CALLED BY: button .fRbuttons.buttUpdate
##+#####################################################################
proc update_plot {} {
global titleMain titleYaxis titleXaxis
global Xmax Xmin Ymax Ymin Xvals Yvals VARbarnames VARsource
global MARGNxminPx MARGNxmaxPx MARGNytopPx MARGNybotPx
global CharHeightPx legend0or1 source0or1
## CharHeightPx is set where win minsize is set, at top of script.
global titlesCOLORreg titlesCOLORsel
## For 3D bars: (not implemented)
# global 3dOnOff
## (Rather than risk making this script more complex than it already is,
## it may be better to create a separate 3D-bars plot script.)
## Rather than depending on global vars to hold the current canvas
## width and height, we query the canvas for current dimensions below.
# global canWidthPx canHeightPx
## This NYtics var could be set by user, via a widget added to the GUI
## --- slider bar or spinbox, say. (But GUI is quite 'busy' now.)
set NYtics 10
## The length of tic-marks could be set by user, via a spinbox, say.
## ticLenPx is in pixels, i.e. positive integer values.
## For now, such a widget is not provided on the GUI.
# set ticLenPx 10
set ticLenPx 5
#########################################################################
## CHECK FOR EQUAL NUMBER OF Xvals & Yvals.
#########################################################################
set NXvals [ llength $Xvals ]
set NYvals [ llength $Yvals ]
if { $NXvals != $NYvals } {
set message "Number-of-Xvals NOT = Number-of-Yvals."
tk_dialog .xxx "Input Err" $message warning 0 Close
## We could use the 'popup_msgVarWithScroll' proc,
## instead of 'tk_dialog'.
return
}
#########################################################################
## CHECK FOR VALID NUMERIC ENTRIES IN $Xvals and $Yvals.
## Not implemented. Rather than preclude some format (that might
## work) by implementing a too-conservative regexp, we let the
## Tk error trace-back dialog greet the user.
## (I think the Tk trace-back is amazingly friendly and thorough.)
#########################################################################
### Example for removing leading and trailing spaces.
## set Xvals [string trim $Xvals]
### Example for splitting the numbers into a list, to process in a loop.
## set XvalsList [ split [string trim $Xvals] " " ]
### Could try something like the following 'regexp'. But this is for
### 3 integer numbers, and we need an arbitrary number of floating-point
## or integer nums.
##
## if [regexp {^([ ]*[0-9]+)[ ]([ ]*[0-9]+)[ ]([ ]*[0-9]+)[ ]*(.*)} $line {} r g b name] {
## .clr insert end "$r $g $b $name"
## } elseif [regexp {^!} $line] {
## } else {
## puts "$me: Can't parse \"$line\""
## }
##
##########################################################
## Make sure we are using the current canvas dimensions to
## place items on the plot canvas.
##########################################################
set canWidthPx [winfo width .fRplot.fRcanvas.c]
set canHeightPx [winfo height .fRplot.fRcanvas.c]
###########################################################
## Call the 'set_margin' proc to set some margin vars to be
## used to set endpoints of x and y axes, etc.
###########################################################
set_margins $NXvals
#####################################################################
## CLEAR THE CANVAS WIDGET in preparation for redraw.
#####################################################################
## Rather drastic:
# .fRplot.fRcanvas.c delete all
## To avoid deletion of image/logo & border:
.fRplot.fRcanvas.c delete TAGrects
.fRplot.fRcanvas.c delete TAGlines
.fRplot.fRcanvas.c delete TAGtext
## where TAGrects is the tag for the bars (filled-rectangles),
## TAGlines is the tag for the axes and tic-marks,
## TAGtext is the tag for the main title, axis-labels, and
## ticmark labels.
###########################################################
## PUT MAIN TITLE NEAR TOP OF THE PLOT-CANVAS.
## (The user can put leading spaces in the main title,
## to control the horizontal position of the title.
## In addition, the user can drag the title.)
###########################################################
set xPX [expr {$MARGNxminPx + 10}]
# set xPx [expr { round(0.10 * $CURcanWidthPx) }]
## Rather than setting the top position of the title to be
## proportional to the canvas height, like so:
## set yPX [expr { int(0.04 * $CURcanHeightPx) }]
## we locate the main title with an offset in pixel units
## from the top of the canvas or from a top margin.
## If we place the text with '-anchor sw' below, we could use
## a 'margin' variable set by the 'set_margins' roc, above,
## such as:
# set yPX $MARGNytopPx
## OR
# set yPX [expr {$MARGNytopPx - 3}]
## If we place the text with '-anchor nw', we could try:
set yPX 4
.fRplot.fRcanvas.c create text \
$xPX $yPX \
-anchor nw \
-text "$titleMain" \
-font fontTEMP_plottitle \
-fill $titlesCOLORreg \
-tag {TAGmoveable TAGtext}
# -justify center \
###########################################################
## SET XMINpx,XMAXpx,YTOPpx,YBOTpx (in canvas pixels)
## for use for end-points of axes.
###########################################################
set XMINpx $MARGNxminPx
set XMAXpx [expr { $canWidthPx - $MARGNxmaxPx } ]
set YTOPpx $MARGNytopPx
set YBOTpx [expr { $canHeightPx - $MARGNybotPx }]
#####################################################
## SETUP FACTORS THAT WILL BE USED TO
## CONVERT DATA VALS TO PIXEL COORDS.
## Units: Pixels per 'world coordinate' units.
## Data type: floating point (not integer)
#####################################################
set PX2UNITSx [expr { double( $XMAXpx - $XMINpx ) / ( $Xmax - $Xmin ) } ]
set PX2UNITSy [expr { double( $YBOTpx - $YTOPpx ) / ( $Ymax - $Ymin ) } ]
## FOR TESTING:
# puts "PX2UNITSx: $PX2UNITSx"
# puts "PX2UNITSy: $PX2UNITSy"
###########################################################
## SET X-AXIS VERTICAL LOCATION (IN PIXELS) --- in XAXISyPX.
## If Ymax & Ymin (in 'world coordinates') straddle 0,
## set X-axis vert-loc according to
## the location of y=0 IN PIXELS --- else use YBOTpx.
## (Convert the distance from Ymin to 0 to pixels, negative.)
###########################################################
set XAXISyPX $YBOTpx
if { $Ymax > 0 && $Ymin < 0 } {
set XAXISyPX [ expr { $YBOTpx + int( $PX2UNITSy * $Ymin) } ]
}
###########################################################
## DRAW X-AXIS ON THE (BAR-CHART) PLOT-CANVAS.
###########################################################
set x0PX $XMINpx
set y0PX $XAXISyPX
set x1PX $XMAXpx
set y1PX $XAXISyPX
.fRplot.fRcanvas.c create line \
$x0PX $y0PX \
$x1PX $y1PX \
-fill black \
-width 2 -capstyle round -tag TAGlines
###########################################################
## PUT THE X-AXIS TITLE ON THE BARCHART-PLOT CANVAS,
## horizontally oriented.
## (The user can put leading spaces in the axis title,
## to control the horizontal position of the title.
## In addition, the user can drag the title.)
## (We use vars that were used to draw the x-axis.)
###########################################################
set xPX [expr { round(($XMAXpx + $XMINpx) / 2) }]
# set xPX [expr { round(($XMAXpx + $XMINpx) / 2) + $MARGNxminPx }]
## An alternative:
# set xPX [expr { $MARGNxminPx + 10 }]
## Get height of font for axis-titles.
set axistitleHeightPx [font metrics fontTEMP_axistitle -linespace]
set yPX [expr { $YBOTpx + $axistitleHeightPx }]
.fRplot.fRcanvas.c create text \
$xPX $yPX \
-anchor n \
-justify left \
-text "$titleXaxis" \
-font fontTEMP_axistitle \
-fill $titlesCOLORreg \
-tag {TAGmoveable TAGtext}
################################################################
## DRAW $NXvals LABELS JUST BELOW THE X-AXIS.
## If a legend was requested, we use integers for the labels,
## from 1 to NXvals.
## Otherwise, we used the Xvals as labels at the spots where
## the integers would go.
## Note that, for placing the labels, we can use the vars
## x0PX=XMINpx,x1PX=XMAXpx,y0PX=XAXISyPX
## that were set just above in drawing the x-axis
## --- the ends of the x-axis and the height of the x-axis.
##
## We locate the labels at equally spaced 'x-ticmarks'.
################################################################
## Set xTicTopPx to locate the top of x-axis tic marks,
## just above the x-axis.
set xTicTopPx [expr { $XAXISyPX - $ticLenPx } ]
## Set xTicBotPx to locate the x-axis tic mark label,
## just below the x-axis.
set xTicBotPx [expr { $XAXISyPX + $ticLenPx } ]
## Set the x-axis tic-mark interval, in pixels.
set xTicIncrPx [expr { round(($XMAXpx - $XMINpx) / ($NXvals + 1)) } ]
## Set the x-axis tic-mark interval, in 'world coordinates'.
## (Not used in this version of the bar chart. Perhaps someday.)
# set xTicIncrWrld [expr { double($Xmax - $Xmin) / ($NXvals + 1) } ]
## Draw the x-axis labels (with tic-marks?).
for {set i 0} {$i < $NXvals} {incr i} {
set xPX [expr {$XMINpx + (($i + 1) * $xTicIncrPx)}]
## Draw an x-axis tic mark.
.fRplot.fRcanvas.c create line \
$xPX $XAXISyPX $xPX $xTicTopPx \
-width 2 -capstyle round -tag TAGlines
## Place an x-axis tic mark label.
## If a legend is requested, used integers for the labels.
## The user can drag them off-canvas if not wanted.
if {$legend0or1 == 1} {
set tempLabel "[expr {$i + 1}]"
} else {
set tempLabel "[lindex $Xvals $i]"
}
.fRplot.fRcanvas.c create text \
$xPX $xTicBotPx \
-text "$tempLabel" \
-anchor n \
-font fontTEMP_SMALL_label \
-tag {TAGmoveable TAGtext}
}
## END OF for {set i 0} {$i <= 10} {incr i}
#############################################
## We have done the X-axis stuff.
## NOW WE DO THE Y-AXIS STUFF.
#############################################
#############################################################
## SET Y-AXIS HORIZONTAL LOCATION (IN PIXELS) --- in YAXISxPX.
## If Xmax & Xmin (in 'world coordinates') straddle 0,
## set Y-axis horiz-loc according to
## the location of x=0 IN PIXELS --- else use XMINpx.
## (Convert the distance from Xmin to 0 to pixels, negative.)
#############################################################
set YAXISxPX $XMINpx
if { $Xmax > 0 && $Xmin < 0 } {
set YAXISxPX [ expr { $XMINpx - int( $PX2UNITSx * $Xmin) } ]
}
############################################################
## DRAW Y-AXIS ON THE (BAR-CHART) PLOT CANVAS,
## in the 'plot rectangle'.
############################################################
set x0PX $YAXISxPX
set y0PX $YBOTpx
set x1PX $YAXISxPX
set y1PX $YTOPpx
.fRplot.fRcanvas.c create line \
$x0PX $y0PX \
$x1PX $y1PX \
-fill black \
-width 2 -capstyle round -tag TAGlines
###########################################################
## PUT THE Y-AXIS TITLE ON THE BARCHART-PLOT CANVAS,
## horizontally oriented, near the top of the plot.
## (The user can put leading spaces in the axis title,
## to control the horizontal position of the title.
## In addition, the user can drag the title.)
## (We use vars that were used to draw the y-axis ---
## y1PX=YTOPpx,y0PX=YBOTpx,x0PX=x1PX=YAXISxPX.)
###########################################################
set xPX [expr { $YAXISxPX + 8 } ]
## We may need to add some logic here to cover the rare case
## when the y-axis is on the far right of the plot canvas.
## But, remember, the user can drag the titles.
## Note that we are placing the text with '-anchor nw' below.
## We position the top of the text a few pixels below the top
## of the y-axis.
set yPX [expr { $YTOPpx + 3 }]
.fRplot.fRcanvas.c create text \
$xPX $yPX \
-anchor nw \
-text "$titleYaxis" \
-font fontTEMP_axistitles \
-fill $titlesCOLORreg \
-tag {TAGmoveable TAGtext}
# -justify left \
###########################################################
## DRAW (NYtics + 1) Y-AXIS TIC-MARKS and label them.
## (NYtics was set above. Could be set via a widget.)
## Note that we are using the vars
## y1PX=YTOPpx,y0PX=YBOTpx,x0PX=x1PX=YAXISxPX
## that were set just above in drawing the y-axis.
###########################################################
## Routine in 'plot.tcl' demo:
## (Note that several values are hard-coded rather than
## being allowed to be set by the user.)
##
## for {set i 0} {$i <= 5} {incr i} {
##
## set y [expr {250 - ($i*40)}]
##
## .fRplot.fRcanvas.c create line 100 $y 105 $y -width 2
##
## .fRplot.fRcanvas.c create text 96 $y \
## -text [expr $i*50].0 \
## -anchor e \
## -font fontTEMP_SMALL_label
## }
###########################################################
## Tic-mark y-increment (in pixels) -- for drawing y-tic marks.
set yTicIncrPx [expr { round(($YBOTpx - $YTOPpx) / $NYtics) } ]
## Locator for right-end of y-Tic-marks (in pixels).
set yTicRightPx [expr { $YAXISxPX + $ticLenPx } ]
## Locator for left-end of y-Tic-marks (in pixels).
## For locating y-ticmark label with '-anchor e'.
set yTicLeftPx [expr { $YAXISxPX - $ticLenPx } ]
## Tic-mark y-increment (in 'world' coord units) -- for drawing y-tic labels.
set yTicIncrWrld [expr { double($Ymax - $Ymin) / $NYtics } ]
for {set i 0} {$i <= $NYtics} {incr i} {
set yPX [expr {$YBOTpx - ($i * $yTicIncrPx)}]
## Draw a y-axis tic mark.
.fRplot.fRcanvas.c create line \
$YAXISxPX $yPX \
$yTicRightPx $yPX \
-width 2 -capstyle round -tag TAGlines
## Place a y-axis tic mark label.
.fRplot.fRcanvas.c create text \
$yTicLeftPx $yPX \
-text [expr {$Ymin + $yTicIncrWrld * $i}] \
-anchor e \
-justify right \
-font fontTEMP_SMALL_label \
-tag {TAGmoveable TAGtext}
}
## END OF for {set i 0} {$i <= 10} {incr i}
#####################################################
## PLOT DATA POINTS as bars (rectangles),
## with an data value at the top of each bar.
## (The user can drag these off-canvas if not wanted.)
#####################################################
## Routine in 'plot.tcl' demo:
##
## foreach point {{12 56} {20 94} {33 98} {32 120} {61 180}
## {75 160} {98 223}} {
##
## set x [expr {100 + (3*[lindex $point 0])}]
##
## set y [expr {250 - (4*[lindex $point 1])/5}]
##
## set item [.fRplot.fRcanvas.c create oval [expr $x-6] [expr $y-6] \
## [expr $x+6] [expr $y+6] -width 1 -outline black \
## -fill SkyBlue2]
##
## .fRplot.fRcanvas.c addtag point withtag $item
## }
#####################################################
#####################################################
## SET WIDTH OF BARS.
## (Could be set by user, via spinbox widget, say.)
#####################################################
set HALFWIDTH_bars 6
#####################################################
## SET COLOR OF BARS.
## (Could add a 'BarColor' button to the GUI.)
#####################################################
# set COLOR_bars "blue"
set COLOR_bars "#0000ff"
## RECALL that xTicIncrPx was set above,
## to draw the x-ticmarks and their labels.
##
## If we were to calculate it here,
## we could set the x-axis tic-mark interval, in pixels.
## set xTicIncrPx [expr { round(($XMAXpx - $XMINpx) / ($NXvals + 1)) } ]
########################################################
## LOOP THRU X,Y DATA LISTS, CREATING BARS.
########################################################
for {set i 0} {$i < $NXvals} {incr i} {
## FOR TESTING:
# puts "Xmin: $Xmin"
# puts "Xval(i): [lindex $Xvals $i]"
# puts "i: $i"
## This may accumulate error.
set xPX [expr {$XMINpx + (($i + 1) * $xTicIncrPx)}]
## So we could try something like:
# set xPX [expr {$XMINpx + int( $PX2UNITSx * ( [lindex $Xvals $i] - $Xmin ) ) } ]
## yPX calculated relative to the x-axis (y=0).
# set yPX [expr {$XAXISyPX - ( $PX2UNITSy * [lindex $Yvals $i] ) } ]
## yPx calculated relative to the bottom of the 'plot rectangle'.
set yPX [expr {$YBOTpx - int( $PX2UNITSy * ( [lindex $Yvals $i] - $Ymin ) ) } ]
## FINALLY, we draw the bars.
.fRplot.fRcanvas.c create rect \
[expr {$xPX - $HALFWIDTH_bars}] $XAXISyPX \
[expr {$xPX + $HALFWIDTH_bars}] $yPX \
-outline black -width 1 -fill $COLOR_bars -tag TAGrects
############################################################
## CREATE TEXT LABEL (Y value) for the current bar,
## above the top of the bar.
############################################################
set text_y [expr {$yPX + 2}]
## To put text in middle of bar. Does not work well for short bars.
# set text_y [expr {$XAXISyPX - ( $PX2UNITSy * ([lindex $Yvals $i] / 2.0) ) } ]
.fRplot.fRcanvas.c create text \
$xPX $text_y \
-anchor s \
-fill black \
-text "[lindex $Yvals $i]"\
-font fontTEMP_sectnum \
-tag {TAGmoveable TAGtext}
}
## END OF LOOP for {set i 0} {$i < $NXvals} {incr i} TO CREATE BARS
#############################################################
## If a legend was requested,
## PUT LEGEND AT BOTTOM OF CANVAS --- loop through the
## 'barnames' of the VARbarnames variable.
#############################################################
if {$legend0or1 == 1} {
set NBARnames [ llength $VARbarnames ]
if { $NBARnames != $NYvals } {
set message "Number-of-BarNames-for-Legend NOT = Number-of-Yvals."
tk_dialog .xxx "Input Err" $message warning 0 Close
return
}
## Indent legend-text-items from left of canvas.
# set text_x 10
set text_x $MARGNxminPx
## Set top of legend at (NBARnames + 1) chars above bottom of canvas.
set CharHeightPx [font metrics fontTEMP_legend -linespace]
set text_y [ expr {$canHeightPx - (($NBARnames + 1) * $CharHeightPx) - 4} ]
###############################################################
## START OF LOOP ON NBARnames, to make legend.
###############################################################
for {set i 0} {$i < $NBARnames} {incr i} {
############################################################
## SET Y-LOCATION OF CURRENT LEGEND TEXT ITEM.
## (Put each item down by the legend font height.)
############################################################
set text_y [ expr {$text_y + $CharHeightPx} ]
## FOR TESTING:
# puts "update_plot > Making legend."
# puts "i: $i"
# puts "text_x: $text_x"
# puts "text_y: $text_y"
############################################################
## CREATE A LEGEND TEXT ITEM.
############################################################
.fRplot.fRcanvas.c create text \
$text_x $text_y \
-anchor nw \
-fill black \
-text "[expr {$i + 1}] - [ lindex $VARbarnames $i ]"\
-font fontTEMP_legend \
-tag {TAGmoveable TAGtext}
}
## END OF LOOP "{set i 0} {$i < $Npcnts} {incr i}" TO CREATE LEGEND
}
## END OF if {$legend0or1 == 1}
#############################################################
## If a DataSource/Note was requested,
## PUT THE TEXT AT THE VERY BOTTOM OF CANVAS.
## (Note that the user can drag it elsewhere.
## We put the note in a lower corner of the canvas.
## In some help instructions, we can tell the user to
## drag the note where they want it.)
#############################################################
if {$source0or1 == 1} {
## To indent the note from left of canvas:
# set text_x 10
## OR
# set text_x $MARGNxminPx
## To indent the note from right of canvas:
set text_x [ expr {$canWidthPx - 2} ]
# set text_x [ expr {$canWidthPx - $MARGNxmaxPx}]
## Set bottom of note near the bottom of canvas.
set text_y [ expr {$canHeightPx - 2} ]
############################################################
## PLACE the DataSource/Note TEXT on the canvas.
## 'se' = lower right ; 'sw' = lower left
############################################################
.fRplot.fRcanvas.c create text \
$text_x $text_y \
-anchor se \
-fill black \
-text "$VARsource"\
-font fontTEMP_source \
-tag {TAGmoveable TAGtext}
}
## END OF if {$source0or1 == 1}
}
## END of proc 'update_plot'
##+#####################################################################
## proc 'getset_bkgdcolor'
##+#####################################################################
##
## PURPOSE:
## This procedure is invoked to get an RGB triplet (r255 g255 b255)
## via 3 RGB slider bars of an 'external' color-selector GUI.
##
## Sets the canvas color and updates a color-label on the GUI.
##
## Arguments: none
##
## CALLED BY: .fRtopbar.togcolor button
##+#####################################################################
proc getset_bkgdcolor {} {
global r255 g255 b255
# global feDIR_tkguis
## FOR TESTING:
# puts "proc 'getset_bkgdcolor' starting."
# puts "r255: $r255"
# puts "g255: $g255"
# puts "b255: $b255"
set TEMPrgb [ exec \
./sho_colorvals_via_sliders3rgb.tk \
$r255 $g255 $b255]
# $feDIR_tkguis/sho_colorvals_via_sliders3rgb.tk \
## FOR TESTING:
# puts "TEMPrgb: $TEMPrgb"
if { "$TEMPrgb" == "" } { return }
scan $TEMPrgb "%s %s %s %s" r255 g255 b255 hexRGB
## FOR TESTING:
# puts "proc 'getset_bkgdcolor' finishing."
# puts "TEMPrgb: $TEMPrgb"
# puts "r255: $r255"
# puts "g255: $g255"
# puts "b255: $b255"
## Set the background (canvas) color.
.fRplot.fRcanvas.c config -bg "#$hexRGB"
.fRbuttons.lab2 config -text "#$hexRGB"
}
## END OF proc 'getset_bkgdcolor'
##+#####################################################################
## proc 'resize_win'
##+#####################################################################
##
## PURPOSE:
## This procedure is invoked to UP/DOWN-size the Tk window by a
## given factor.
##
## Several methods could be used.
## For now, we query the current width and height (and location)
## of the window (with 'winfo' and 'wm') and apply the factor.
##
## Arguments: a size factor (can be less than 1 or greater than 1)
##
## CALLED BY: 'upsize_canvas' and 'downsize_canvas' procs
##
##+#####################################################################
proc resize_win {factor} {
################################################################
## This is not the exact window dimensions we want, but they
## are close enough. These do not include the window decoration.
################################################################
set winXlen [ winfo width . ]
set winYlen [ winfo height . ]
##################################################################
## This is not the location we want. It is the upper-left of
## the window without the window decoration. Try again, with 'wm'.
##################################################################
# set winXloc [ winfo rootx . ]
# set winYloc [ winfo rooty . ]
## Adjust the 'loc' vars for the window manager border.
# set winXloc [ expr {$winXloc - 3} ]
# set winYloc [ expr {$winYloc - 23} ]
##########################################################
## Get the true location of the upper left of the window.
##########################################################
set WMgeom [wm geometry .]
# set WMsize [lindex [split $WMgeom '+'] 0]
set winXloc [lindex [split $WMgeom '+'] 1]
set winYloc [lindex [split $WMgeom '+'] 2]
## FOR TESTING:
# puts "proc 'resize_win' - Before:"
# puts "winXlen : $winXlen"
# puts "winYlen : $winYlen"
# puts "winXloc : $winXloc"
# puts "winYloc : $winYloc"
#######################################################
## Resize the window size by 'factor'.
#######################################################
set winXlen [expr {int( $factor * $winXlen )} ]
set winYlen [expr {int( $factor * $winYlen )} ]
###############################################
## Set the new size and location of the window.
###############################################
########################################################
## Tried the following 'wm positionfrom . user'
## command to resize the window EVEN IF
## the user has maximized the window.
## DOES NOT SEEM TO WORK on Linux with X-windows
## (Ubuntu 9.10, Gnome 2.x desktop & window manager).
## Might work with some window managers.
########################################################
## Ref: page 245 in Section 'Positioning Main Widget' in
## Chapter 7 'Dialog Windows' of the book
## Graphical Applications in Tcl & Tk (1st edition)
## by Eric F. Johnson.
########################################################
## According to a Tk 8.5 reference manual, Tk sets
## 'user' mode, rather than 'program' mode, by default.
## So this was probably already set. It was worth a try.
########################################################
# wm positionfrom . user
wm geometry . ${winXlen}x${winYlen}+${winXloc}+${winYloc}
## FOR TESTING:
# puts "proc 'resize_win' - After:"
# puts "winXlen : $winXlen"
# puts "winYlen : $winYlen"
# puts "winXloc : $winXloc"
# puts "winYloc : $winYloc"
}
## END OF proc 'resize_win'
##+#####################################################################
## proc 'downsize_canvas'
##+#####################################################################
##
## PURPOSE:
## This procedure is invoked to DOWN-size the canvas.
##
## We apply a factor to the current width and height of the canvas.
##
## Arguments: none other than global vars
##
## CALLED BY: .fRbuttons.buttDWNwin
##
## The user can keep clicking the button to downsize ~10% per click.
##
##+#####################################################################
proc downsize_canvas {} {
################################################################
## Downsize the window somewhat, so that the 'fill' pack-option
## of the canvas does not cause the canvas to keep the window
## from downsizing --- and/or so that the window surrounding the
## diminished canvas is not taking up too much screen space.
## (We seem to need to do this; especially if the user expands
## the window to max size with 'UpCan'.)
################################################################
## FOR TESTING:
# wm geometry . 640x480+100+100
if {1} {
# resize_win 0.97
## 0.97 seems to be too much. May clip some text.
## But user can grab edge of window and drag to show the text.
resize_win 0.98
# resize_win 0.99
}
## END OF if {0}/{1} COMMENTABLE SECTION
#############################################
## Decrease the canvas size about 10% or 5%.
#############################################
set CURcanWidthPx [winfo width .fRplot.fRcanvas.c]
set CURcanHeightPx [winfo height .fRplot.fRcanvas.c]
set factor 0.40
# set factor 0.90
# set factor 0.95
set NEWcanWidthPx [expr {int( $factor * $CURcanWidthPx )} ]
set NEWcanHeightPx [expr {int( $factor * $CURcanHeightPx )} ]
.fRplot.fRcanvas.c configure -width $NEWcanWidthPx -height $NEWcanHeightPx
#####################################################
## Re-pack the canvas frames, for the new canvas size.
#####################################################
## (We seem to need this section to down-size
## the canvas and window --- especially if the user
## expands the window to max size with 'UpCan'.
## A simple 'update' plus window downsize, above,
## does not seem to be enough.)
## (An 'if 1 or 0' clause is added here to facilitate
## experimentation with the presence or absence
## of this code.)
#####################################################
if {1} {
pack forget .fRplot.fRcanvas.c .fRplot.fRcanvas .fRplot
pack .fRplot \
-side top \
-anchor center \
-fill both \
-expand 1
pack .fRplot.fRcanvas \
-side right \
-anchor center \
-fill both \
-expand 1
pack .fRplot.fRcanvas.c \
-side top \
-anchor nw \
-fill both \
-expand 1
}
## END OF if {0}/{1} COMMENTABLE SECTION
################################################################
## Simply doing an 'update' to force the window to
## resize --- according to the current canvas size-request and
## the 'fill' pack-option for the canvas --- does not seem to
## suffice. We seem to need to do the re-pack.
################################################################
if {1} {
update
}
## END OF if {0}/{1} COMMENTABLE SECTION
####################################################
# Re-do the plot, according to the new canvas size.
####################################################
update_plot
}
## END OF proc 'downsize_canvas'
##+#####################################################################
## proc 'upsize_canvas'
##+#####################################################################
##
## PURPOSE:
## This procedure is invoked to UP-size the canvas.
##
## We apply a factor to the current width and height of the canvas.
##
## Arguments: none other than global vars
##
## CALLED BY: .fRbuttons.buttUPwin
##
## The user can keep clicking the button to upsize ~10% per click.
##
##+#####################################################################
proc upsize_canvas {} {
################################################################
## Upsize the window, so that the enlarged canvas is
## pretty sure to show. (If the enlarged canvas is still clipped
## by the window size, the user can enlarge the window in the
## usual window-manager ways.)
################################################################
if {1} {
# resize_win 1.1
resize_win 1.05
}
## END OF if {0}/{1} COMMENTABLE SECTION
############################################
## Increase the canvas size about 10% or 5%.
############################################
set CURcanWidthPx [winfo width .fRplot.fRcanvas.c]
set CURcanHeightPx [winfo height .fRplot.fRcanvas.c]
# set factor 1.1
set factor 1.05
set NEWcanWidthPx [expr {int( $factor * $CURcanWidthPx )} ]
set NEWcanHeightPx [expr {int( $factor * $CURcanHeightPx )} ]
.fRplot.fRcanvas.c configure -width $NEWcanWidthPx -height $NEWcanHeightPx
#####################################################
# Re-pack the canvas frames, for the new canvas size.
#####################################################
## COMMENTED this section. It appears that we do not need to re-pack,
## in this 'upsize_can' proc, although we may need to do this
## in the 'downsize_can' proc. The window up-size above seems to
## work to make the window-and-canvas upsize in essentially all
## scenarios.
####################################################################
if {0} {
pack forget .fRplot.fRcanvas.c .fRplot.fRcanvas .fRplot
pack .fRplot \
-side top \
-anchor center \
-fill both \
-expand 1
pack .fRplot.fRcanvas \
-side right \
-anchor center \
-fill both \
-expand 1
pack .fRplot.fRcanvas.c \
-side top \
-anchor nw \
-fill both \
-expand 1
}
## END OF if {0}/{1} COMMENTABLE SECTION
################################################################
## Simply doing an 'update' to force the window to
## size-up --- according to the current canvas size-request and
## the 'fill' pack-option for the canvas --- does not seem to
## suffice. But resizing the window, above, seems to work.
################################################################
## BUT we do need this 'update' to expand the plot within
## the current canvas size, because this 'update' is needed
## so that 'update_plot' can get the true current canvas size.
################################################################
if {1} {
update
}
## END OF if {0}/{1} COMMENTABLE SECTION
####################################################
# Re-do the plot, according to the new canvas size.
####################################################
update_plot
}
## END OF proc 'upsize_canvas'
##+#####################################################################
## proc 'draw_border'
##+#####################################################################
##
## PURPOSE:
## This procedure is invoked to toggle a border on/off around the
## edge of the canvas.
##
## Arguments: none
##
## CALLED BY: button .fRbuttons.buttBorder
##+#####################################################################
proc draw_border {} {
global border0or1
if { "$border0or1" == 0 } {
## Restoring the whole plot with 'update_plot' is one way to
## remove the border --- but you lose changes like title/tic-mark moves.
## update_plot
## This will delete the lines & arcs that were drawn with code below.
.fRplot.fRcanvas.c delete TAGborder
return
}
set CURcanWidthPx [winfo width .fRplot.fRcanvas.c]
set CURcanHeightPx [winfo height .fRplot.fRcanvas.c]
#################################################
## Set border line-width (pixels) & line-color.
#################################################
set bordWIDTH 2
# set bordCOLOR black
set bordCOLOR #000000
#################################################
## Set border limits.
#################################################
set BDxminPx [expr { 0.01 * $CURcanWidthPx } ]
set BDxmaxPx [expr { 0.99 * $CURcanWidthPx } ]
set BDytopPx [expr { 0.01 * $CURcanHeightPx }]
set BDybotPx [expr { 0.99 * $CURcanHeightPx }]
# set BDxminPx [expr { 0.005 * $CURcanWidthPx } ]
# set BDxmaxPx [expr { 0.995 * $CURcanWidthPx } ]
# set BDytopPx [expr { 0.005 * $CURcanHeightPx }]
# set BDybotPx [expr { 0.995 * $CURcanHeightPx }]
#################################################
## Set corner arc border-radius.
#################################################
set minDim $CURcanWidthPx
if { $minDim > $CURcanHeightPx } { set minDim $CURcanHeightPx }
set bradPx [expr { round(0.03 * $minDim) } ]
#################################################
## Draw the four border lines (left,right,top,bot).
#################################################
.fRplot.fRcanvas.c create line \
$BDxminPx [expr { $BDytopPx + $bradPx } ] \
$BDxminPx [expr { $BDybotPx - $bradPx } ] \
-width $bordWIDTH -fill $bordCOLOR \
-tag TAGborder
.fRplot.fRcanvas.c create line \
$BDxmaxPx [expr { $BDytopPx + $bradPx } ] \
$BDxmaxPx [expr { $BDybotPx - $bradPx } ] \
-width $bordWIDTH -fill $bordCOLOR \
-tag TAGborder
.fRplot.fRcanvas.c create line \
[expr { $BDxminPx + $bradPx } ] $BDytopPx \
[expr { $BDxmaxPx - $bradPx } ] $BDytopPx \
-width $bordWIDTH -fill $bordCOLOR \
-tag TAGborder
.fRplot.fRcanvas.c create line \
[expr { $BDxminPx + $bradPx } ] $BDybotPx \
[expr { $BDxmaxPx - $bradPx } ] $BDybotPx \
-width $bordWIDTH -fill $bordCOLOR \
-tag TAGborder
#################################################
## Draw the four border arcs (UL,UR,LR,LL).
#################################################
.fRplot.fRcanvas.c create arc \
$BDxminPx $BDytopPx \
[expr { $BDxminPx + 2*$bradPx } ] [expr { $BDytopPx + 2*$bradPx } ] \
-start 90 \
-extent 90 \
-style arc -width $bordWIDTH -fill $bordCOLOR \
-tag TAGborder
.fRplot.fRcanvas.c create arc \
$BDxmaxPx $BDytopPx \
[expr { $BDxmaxPx - 2*$bradPx } ] [expr { $BDytopPx + 2*$bradPx } ] \
-start 0 \
-extent 90 \
-style arc -width $bordWIDTH -fill $bordCOLOR \
-tag TAGborder
.fRplot.fRcanvas.c create arc \
$BDxmaxPx $BDybotPx \
[expr { $BDxmaxPx - 2*$bradPx } ] [expr { $BDybotPx - 2*$bradPx } ] \
-start 270 \
-extent 90 \
-style arc -width $bordWIDTH -fill $bordCOLOR \
-tag TAGborder
.fRplot.fRcanvas.c create arc \
$BDxminPx $BDybotPx \
[expr { $BDxminPx + 2*$bradPx } ] [expr { $BDybotPx - 2*$bradPx } ] \
-start 180 \
-extent 90 \
-style arc -width $bordWIDTH -fill $bordCOLOR \
-tag TAGborder
}
## END of proc 'draw_border'
##+#####################################################################
## proc 'get_image'
##+#####################################################################
##
## PURPOSE:
## This procedure is invoked to put an image (ex: a logo or
## decorative image) on the canvas.
##
## Arguments: none
##
## CALLED BY: button .fRbuttons.buttImage
##+#####################################################################
## PRINTING NOTE:
## The image (logo) is not captured by the postscript Print button opts.
## But a screen image could be captured with a screen/window capture
## utility --- such as 'gnome-screenshot' on Linux --- for insertion in
## e-mails, web docs, or other docs.
##
## The captured image could be cropped with an image editor, such as
## 'mtpaint' on Linux.
##
## The captured-and-cropped image could be printed with an image
## view-print utility, such as 'eog' (Eye of Gnome) on Linux.
##
## DRAGABILITY NOTE:
##
## This image/logo is draggable, if bindings above and bind tags
## are implemented appropriately.
##
## If it is decided that the image is not wanted, it can be dragged
## off the canvas, out of sight.
##+#####################################################################
## Set a default directory from which to start the navigation
## to an image file.
# set curDIR "$env(HOME)"
set curDIR [pwd]
proc get_image {} {
global env curDIR img1
set CURcanWidthPx [winfo width .fRplot.fRcanvas.c]
set CURcanHeightPx [winfo height .fRplot.fRcanvas.c]
## Get filename of a image file.
set fName [tk_getOpenFile -parent . -title "Select image file (GIF/PNG) to load" \
-initialdir "$curDIR" ]
## FOR TESTING:
# puts "fName : $fName"
if {[file exists $fName]} {
set endIDX [ expr {[string last "/" "$fName" ] - 1} ]
set curDIR [ string range "$fName" 0 $endIDX ]
# image create photo img1 -file "$fName"
set img1 [image create photo -file "$fName"]
## FOR TESTING:
# puts "get_image > img1: $img1"
## Put the southeast corner of the image near the
## lower-right corner of the canvas.
## Note the use of '-anchor se'.
## This image can be dragged, by the user, to another
## location on the canvas.
set x [expr { 0.99 * $CURcanWidthPx } ]
set y [expr { 0.99 * $CURcanHeightPx }]
.fRplot.fRcanvas.c create image \
$x $y \
-anchor se \
-image $img1 \
-tag {TAGmoveable TAGimage}
}
}
## END of proc 'get_image'
##+########################################################################
## proc 'popup_msgVarWithScroll'
##+########################################################################
## PURPOSE: Report help or error conditions to the user.
##
## We do not use focus,grab,tkwait in this proc,
## because we use it to show help when the GUI is idle,
## and we may want the user to be able to keep the Help
## window open while doing some other things with the GUI
## such as putting a filename in a filename entry field
## or clicking on a radiobutton.
##
## For a similar proc with focus-grab-tkwait added,
## see the proc 'popup_msgVarWithScroll_wait' in a
## 3DterrainGeneratorExaminer Tk script.
##
## REFERENCE: page 602 of 'Practical Programming in Tcl and Tk',
## 4th edition, by Welch, Jones, Hobbs.
##
## ARGUMENTS: A toplevel frame name (such as .fRhelp or .fRerrmsg)
## and a variable holding text (many lines, if needed).
##
## CALLED BY: 'help' button or to show msgs
##+########################################################################
## To have more control over the formatting of the message (esp.
## words per line), we use this 'toplevel-text' method,
## rather than the 'tk_dialog' method -- like on page 574 of the book
## by Hattie Schroeder & Mike Doyel,'Interactive Web Applications
## with Tcl/Tk', Appendix A "ED, the Tcl Code Editor".
##+########################################################################
proc popup_msgVarWithScroll { toplevName VARtext } {
## global fontTEMP_varwidth #; Not needed. 'wish' makes this global.
## global env
# bell
# bell
#################################################
## Set VARwidth & VARheight from $VARtext.
#################################################
## To get VARheight,
## split at '\n' (newlines) and count 'lines'.
#################################################
set VARlist [ split $VARtext "\n" ]
## For testing:
# puts "VARlist: $VARlist"
set VARheight [ llength $VARlist ]
## For testing:
# puts "VARheight: $VARheight"
#################################################
## To get VARwidth,
## loop through the 'lines' getting length
## of each; save max.
#################################################
set VARwidth 0
#############################################
## LOOK AT EACH LINE IN THE LIST.
#############################################
foreach line $VARlist {
#############################################
## Get the length of the line.
#############################################
set LINEwidth [ string length $line ]
if { $LINEwidth > $VARwidth } {
set VARwidth $LINEwidth
}
}
## END OF foreach line $VARlist
## For testing:
# puts "VARwidth: $VARwidth"
###############################################################
## NOTE: VARwidth works for a fixed-width font used for the
## text widget ... BUT the programmer may need to be
## careful that the contents of VARtext are all
## countable characters by the 'string length' command.
###############################################################
#####################################
## SETUP 'TOP LEVEL' HELP WINDOW.
#####################################
catch {destroy $toplevName}
toplevel $toplevName
# wm geometry $toplevName 600x400+100+50
wm geometry $toplevName +100+50
wm title $toplevName "Note"
# wm title $toplevName "Note to $env(USER)"
wm iconname $toplevName "Note"
#####################################
## In the frame '$toplevName' -
## DEFINE THE TEXT WIDGET and
## its two scrollbars --- and
## DEFINE an OK BUTTON widget.
#####################################
text $toplevName.text \
-wrap none \
-font fontTEMP_varwidth \
-width $VARwidth \
-height $VARheight \
-bg "#f0f0f0" \
-relief raised \
-bd 2 \
-yscrollcommand "$toplevName.scrolly set" \
-xscrollcommand "$toplevName.scrollx set"
scrollbar $toplevName.scrolly \
-orient vertical \
-command "$toplevName.text yview"
scrollbar $toplevName.scrollx \
-orient horizontal \
-command "$toplevName.text xview"
button $toplevName.butt \
-text "OK" \
-font fontTEMP_varwidth \
-command "destroy $toplevName"
###############################################
## PACK *ALL* the widgets in frame '$toplevName'.
###############################################
## Pack the bottom button BEFORE the
## bottom x-scrollbar widget,
pack $toplevName.butt \
-side bottom \
-anchor center \
-fill none \
-expand 0
## Pack the scrollbars BEFORE the text widget,
## so that the text does not monopolize the space.
pack $toplevName.scrolly \
-side right \
-anchor center \
-fill y \
-expand 0
## DO NOT USE '-expand 1' HERE on the Y-scrollbar.
## THAT ALLOWS Y-SCROLLBAR TO EXPAND AND PUTS
## BLANK SPACE BETWEEN Y-SCROLLBAR & THE TEXT AREA.
pack $toplevName.scrollx \
-side bottom \
-anchor center \
-fill x \
-expand 0
## DO NOT USE '-expand 1' HERE on the X-scrollbar.
## THAT KEEPS THE TEXT AREA FROM EXPANDING.
pack $toplevName.text \
-side top \
-anchor center \
-fill both \
-expand 1
#####################################
## LOAD MSG INTO TEXT WIDGET.
#####################################
## $toplevName.text delete 1.0 end
$toplevName.text insert end $VARtext
$toplevName.text configure -state disabled
}
## END OF proc 'popup_msgVarWithScroll'
##+#####################################################################
## proc 'print_plot' (Sample code. Not tested and implemented.)
##+#####################################################################
##
## PURPOSE:
## This procedure is invoked to print the canvas image: .fRplot.fRcanvas.c
##
## Arguments: none
##
## CALLED BY: button .fRbuttons.buttPrint
##+#####################################################################
proc print_plot {} {
global env feDIR
set tmp_filename "/tmp/$env(USER)_tmp_tkplot.ps"
eval exec rm -f "$tmp_filename"
.fRplot.fRcanvas.c postscript -file "$tmp_filename" \
-colormode color \
-pageheight 10i \
-pagewidth 7i \
-pagex 1i \
-pagey 1i \
-pageanchor sw
# -colormode color
# -colormode gray
# -colormode monochrome
## Use some external utility to print the postscript file.
## Examples:
# set PRINTcmd "/usr/bin/kprinter"
# set PRINTcmd "/usr/bin/hp-print"
set fePRINTcmd "/usr/bin/cupsdoprint -H localhost:631 -P lp1"
# eval exec rm "$tmp_filename"
}
## END of proc 'print_plot'
##+#####################################################################
## proc 'print_preview' (Sample code. Not tested and implemented.)
##+#####################################################################
##
## PURPOSE:
## This procedure is invoked to preview the Postscript file of the
## canvas image: .fRplot.fRcanvas.c
##
## Arguments: none
##
## CALLED BY: button .fRbuttons.buttPrtPreview
##+#####################################################################
proc print_preview {} {
global env
set tmp_filename "/tmp/$env(USER)_tmp_tkplot.ps"
eval exec rm -f "$tmp_filename"
.fRplot.fRcanvas.c postscript -file "$tmp_filename" \
-colormode color \
-pageheight 10i \
-pagewidth 7i \
-pagex 1i \
-pagey 1i \
-pageanchor sw
# -colormode color
# -colormode gray
# -colormode monochrome
## Set an appropriate Postscript viewer app here.
# set PSviewer "xpsview"
set PSviewer "evince"
eval exec "$PSviewer $tmp_filename &"
# eval exec rm "$tmp_filename"
}
## END of proc 'print_preview'
##+######################################################
## Additional GUI INITIALIZATION:
##
## Make a plot from the default entries.
##+######################################################
##+####################################################
## We can activate one of the following sets of initial
## plot settings by changing 'if {0}' to 'if {1}'.
##+####################################################
## A generic plot example.
## Since desc. of each point along x-axis is short (about 4 char nums),
## we do not use a legend. We want to label the x-axis with the nums.
## We do not indicate a data source in this generic plot example.
if {1} {
set titleMain " MAIN PLOT TITLE here."
set titleXaxis " X-AXIS TITLE here."
set titleYaxis " Y-AXIS TITLE here."
## The user can add leading spaces to the titles to help
## position them horizontally. In addition, the titles
## can be dragged.
set Xmin "0"
# set Xmin "0.0" ; ## Causes tic-labels to go to 1-decimal format.
set Xmax "100"
# set Xmax "100.0" ; ## Causes tic-labels to go to 1-decimal format.
set Ymin "0"
# set Ymin "0.0" ; ## Causes tic-labels to go to 1-decimal format.
set Ymax "100"
# set Ymax "100.0" ; ## Causes tic-labels to go to 1-decimal format.
set Xvals "10.0 30.0 50.0 70.0 90.0"
set Yvals "15.0 39.0 45.0 79.0 62.0"
set legend0or1 0
set VARbarnames ""
set source0or1 0
set VARsource ""
}
## END OF if {0}/{1}
## Sample data Group1, for further testing of this GUI.
## (Federal budget 2012; xaxis = integers, count of each bar)
## Since desc. of each point along x-axis is long, we use a legend
## corresponding to integers along the x axis.
## We do not indicate data source. It is indicated by the title.
if {0} {
set titleMain " President's proposed federal budget, sent to Congress Feb 2012"
set titleXaxis " Budget items"
set titleYaxis " Percent of Budget"
set Xmin "0"
set Xmax "6"
set Ymin "0"
set Ymax "100"
set Xvals "1 2 3 4 5 6"
set Yvals "60 4 5 6 6 19"
set legend0or1 1
set VARbarnames "\
\"1 - Military (DeptOfDefense, Wars, VetAffairs, NuclearWeaponsPrograms)\" \
\"2 - DeptOfHomelandSec.\" \
\"3 - StateDept\" \
\"4 - HealthAndHumanServices\" \
\"5 - Education\" \
\"6 - Other (HUD, Ag, Justice, NASA, Energy excl. NukeWeapons, Labor, Interior, EPA, etc.)\""
set source0or1 0
set VARsource ""
}
## END OF if {0}/{1}
## Sample data Group2, for further testing of this GUI.
## (World population growth ; xaxis = years)
## The desc. of each point along x-axis is short (4-digit years).
## We do NOT use a legend. We want to label the x-axis with the years.
## We indicate several sources for the data.
if {0} {
set titleMain "World Population Growth"
set titleXaxis "Year"
set titleYaxis "Population in millions"
set Xmin "1700"
set Xmax "2100"
set Ymin "0"
set Ymax "6000"
set Xvals "1750 1800 1850 1900 1950 2000"
set Yvals "750 1000 1250 1650 2500 6000"
set legend0or1 0
set VARbarnames ""
set source0or1 0
set VARsource "Historical population books, U.S.Gov data, and U.N. data"
}
## END OF if {0}/{1}
## Sample data Group3, for further testing of this GUI.
## (Lion population in Africa ; xaxis = years ; only 2 data points)
## The desc. of each point along x-axis is short (4-digit years).
## We do NOT use a legend. We want to label the x-axis with the years.
## We indicate that a source of the data is forthcoming.
if {0} {
set titleMain "Lion Population (de)Growth in Africa"
set titleXaxis "Year"
set titleYaxis "Population"
set Xmin "1960"
set Xmax "2010"
set Ymin "0"
set Ymax "300000"
set Xvals "1960 2010"
set Yvals "250000 20000"
set legend0or1 0
set VARbarnames ""
set source0or1 1
set VARsource "Source: http:??? (to be added)"
}
## END OF if {0}/{1}
## Sample data Group4, for further testing of this GUI.
## (Oyster harvest in Chesapeake Bay ; xaxis = years)
## The desc. of each point along x-axis is short (4-digit years).
## We do NOT use a legend. We want to label the x-axis with the years.
## We provide a source of the data.
if {0} {
set titleMain "Oyster Harvest (Commercial) in the Chesapeake Bay"
set titleXaxis "Year"
set titleYaxis "Bushels"
set Xmin "1960"
set Xmax "2010"
set Ymin "0"
set Ymax "7000000"
set Xvals "1960 1970 1980 1990 2000 2010"
set Yvals "5500000 3500000 3200000 800000 400000 200000"
set legend0or1 0
set VARbarnames ""
set source0or1 1
set VARsource "Source: www.cheapeakebay.net/status_oysertharvest.aspx"
}
## END OF if {0}/{1}
## Sample data Group5, for further testing of this GUI.
## (Cheetah population in the world ; xaxis = years)
## The desc. of each point along x-axis is short (4-digit years).
## We do NOT use a legend. We want to label the x-axis with the years.
## We provide a source of the data.
if {0} {
set titleMain "Cheetah Population (de)Growth in the world"
set titleXaxis "Year"
set titleYaxis "Population"
set Xmin "1900"
set Xmax "2010"
set Ymin "0"
set Ymax "100000"
set Xvals "1900 1980 2010"
set Yvals "1000000 23000 2000"
set legend0or1 0
set VARbarnames ""
set source0or1 1
set VARsource "Source: www.american.edu/TED/cheetah.htm"
}
## END OF if {0}/{1}
## Sample data Group6, for further testing of this GUI.
## (Bison population in No.America ; xaxis = years)
## The desc. of each point along x-axis is short (4-digit years).
## We do NOT use a legend. We want to label the x-axis with the years.
## We provide a source of the data.
if {0} {
set titleMain "North American (pure) Bison Population"
set titleXaxis "Year"
set titleYaxis "Population"
set Xmin "1700"
set Xmax "2010"
set Ymin "0"
set Ymax "500000000"
set Xvals "1700 1870 2010"
set Yvals "30000000 2000 30000"
set legend0or1 0
set VARbarnames ""
set source0or1 1
set VARsource "Source: www.defenders.org/bison/basic-facts & www.fws.gov/bisonrange/timeline.htm"
}
## END OF if {0}/{1}
## Sample data Group7, for further testing of this GUI.
## (Elephant population in Africa ; xaxis = years)
## The desc. of each point along x-axis is short (4-digit years).
## We do NOT use a legend. We want to label the x-axis with the years.
## We provide a source of the data.
if {0} {
set titleMain "Estimated Elephant Population in Africa"
set titleXaxis "Year"
set titleYaxis "Population"
set Xmin "1900"
set Xmax "2010"
set Ymin "0"
set Ymax "5000000"
set Xvals "1930 2010"
set Yvals "4000000 400000"
set legend0or1 0
set VARbarnames ""
set source0or1 1
set VARsource "Source: wwf.panda.org/what_we_do/endangered_species/elephants/african_elephants/ & en.wikipedia.org/wiki/Elephant"
}
## END OF if {0}/{1}
## Sample data Group8, for further testing of this GUI.
## (U.S. Budget Surplus/Deficit ; xaxis = years)
## The desc. of each point along x-axis is short (4-digit years).
## We do NOT use a legend. We want to label the x-axis with the years.
## In place of data-source, we provide a note on who was president in various years.
if {0} {
set titleMain "U.S. Budget Surplus/Deficit"
set titleXaxis "Year"
set titleYaxis "Billions of dollars"
set Xmin "1988"
set Xmax "2005"
set Ymin "-500"
set Ymax "200"
set Xvals "1989 1990 1991 1992 1993 1994 1995 1996 1997 1998 1999 2000 2001 2002 2003 2004"
set Yvals "-150 -210 -260 -290 -250 -200 -160 -105 -10 70 110 220 110 -160 -380 -510"
set legend0or1 0
set VARbarnames ""
set source0or1 1
set VARsource "Bush Sr. (1989-1992), Clinton (1993-2000), Bush Jr. (2001-2004)"
}
## END OF if {0}/{1}
##+###########################################################
## Initialize the plot.
## ('update' is needed to pack the canvas before calling
## 'update_plot', which uses the canvas size to do the plot.)
##+###########################################################
update
update_plot
So here is the second of 5 'PlotQuik' utilities to be converted to stand-alone mode from their 'integrated' form in the 'feHandyTools' system of the Freedom Environment software.
Other Tk plot scripts to follow:
3) math expression xy-plot, created from an expression entered on the GUI
4) points and/or lines xy-plot, created from data entered on the GUI
5) xy-plot, from a text file of columns of data (2 or 3 columns can be selected for x-y plots or x-y1-y2 plots)
SOME FEATURES in the BarChart CODE
Here are some features of the code that a Tcler may find useful or of interest.
1) I put most of the text strings for buttons and labels in an array, aRtext, near the top of the code. This should make internationalization of this script much easier.
2) Near the bottom of the PROCS section of this code, I put 'print_plot' and 'print_preview' procs. I put sample (untested but plausible) code for those procs in the script, in case some users would like to be able to make a Postscript file from the plot image. (I never do that. The results are often disappointing. I usually do screen captures.)
3) I added the suffix 'Px' or 'PX' or 'px' on the end of many of the variable names of the code --- so that it is clear (without scanning the code) that these variables are intended to be integer variables (denoting pixels), rather than floating-point variables (denoting 'world coordinates').
I also started all tag names with the capitalized string 'TAG', so that it is clear which names are tag-names.
As I write more and more large scripts, I am gradually developing some naming standards that make it easier for me to recognize what sections of code are meant to do --- without having to search back and forth through many screenfuls of code. (But it seems to be a never-ending process. Whenever I look at code months later, I see more I could do to help me remember, at a glance, what the code was supposed to do.)
4) At the bottom of the script are about 8 sets of sample data that can be set as the initial data that appears in the GUI --- simply by switching 'if {0}' and 'if {1}' statements. (In fact, I have not run all of those tests and plan to run them in coming weeks --- which may lead to a few more tweaks of the code. But 99% of the code is in place. Fixes and enhancements will be nothing compared to the amount of code that was needed to put this GUI in place, with parameter variables that facilitate a lot of customization-of and experimentation-with the GUI appearance and function.)
SOME OPERATIONAL FEATURES of the BarChart GUI
1) To implement the 'UpCan' and 'DwnCan' buttons, I am using 'resize_win', 'downsize_can', and 'upsize_can' procs --- like I did in the pie-chart code.
Like the pie-chart GUI, the 'DwnCan' button will not do its job if the user has maximized the GUI window VIA THE WINDOW MANAGER (the Maximize/Restore button) of their operating system. The user can simply click on the 'Restore' button of the window. Then 'DwnCan' should work again. If the user maximizes the GUI window via the 'UpCan' button, 'DwnCan' works as intended.
2) You can run the pointer (mouse cursor) over items on the GUI. As was mentioned above, the text items that are moveable will show in red. As you move those items around on the canvas, they stay red. When you release the mouse button after a move, their color returns to the default (black).
3) If the user chooses to add a DataSource/Note line of text to the GUI, that line of text is put in the lower right corner of the GUI. The user can move it anywhere they want on the canvas. The same applies to all the text items, such as data labels along the axes. In fact, some times, the number zero at the origin does not seem necessary. If it is not wanted, the user can drag it off the canvas, out of sight, before taking a screen capture of the GUI. In fact, you can even drag the image off the canvas. Click on the 'UpdatePlot' button and the off-canvas items are placed back on the canvas. (Actually, the text items are regenerated according to the data in the entry fields.)
FURTHER DEVELOPMENT of the BarChart GUI
1) The brief 'help instructions' on the left of the GUI cannot do justice to the many operational features of this bar-chart GUI --- such as the features mentioned above. In coming months, I will probably implement a 'Help' button on the GUI to provide more extensive help --- for example, to explain that the 'DwnCan' button may not work if the user has maximized the GUI window via the user's window manager --- and to explain some of the things one can do with the drag-item features of the GUI.
---
At least a few parameters are hard-coded in this script. To avoid putting too many widgets on the GUI (but at the same time wanting to make most of the features immediately obvious and immediately accessible), I did not put more widgets on this 'first pass' of this utility.
2) One of the parameters that users may want control over is the color of the bars. So, in addition to a 'Help' button, I may add a 'BarColor' button to the GUI so that the user can easily choose the color of the bars, as well as the color of the canvas background.
3) In addition, users will probably want control over the width of the bars.
4) And they may wish to be able to turn off the outline around the bars.
5) Users may need to be able to set the number of ticmarks on the y-axis.
I will probably sacrifice the 'Canvas Background Color:' text at the top right of the GUI to allow room for a few more buttons/widgets. I can indicate the last-color settings performed by the color buttons by applying the color to the 'BkgdColor' and 'BarColor' buttons, as I have done in several other scripts on this wiki.
Of course, another option to consider adding would be a 3D plot request (checkbutton).
Back in 2005, Suchenwirth posted a demo 3D bar chart:
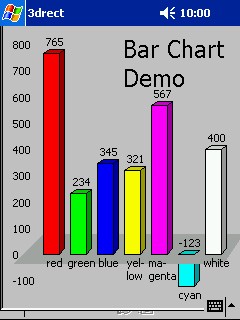
at A little bar chart. The image and code is also posted at [L4 ].
If a 3D option were to be added to this code, there could be even more options with respect to the 3D plot feature --- angles of view (longitude and latitude), choice of a different color for each bar, shadow effects, etc. Rather than complicate the code and the GUI of this 'flat' barchart utility, if I ever make a 3D bar chart utility, I will probably make a separate script.
Summing up, I plan to add the following to this 'flat' barchart utility.
- A 'Help' button
- A 'BarColor' button (allow a different color for each bar?)
- Add color to the Color buttons
- A bar-width widget
- A bar-outline checkbutton
- A widget for setting the number of ticmarks on the y-axis
- Touch up some font-related variables/code
- Test about 8 other data sets (with consequent tweaks/fixes to the code).
So I will probably provide a few updates to the code in coming months. (This is a 'beta' release.)