A Tachometer-style Meter --- for CPU Usage
uniquename - 2013dec05
In mid-2013, I put it on my 'to do' list to implement some practical applications for the nice 'tachometer style' meter for which Marco Maggi provided a demo script [L1 ] back in 2003.
I have implemented three applications of this meter:
- to show memory and swap used on my computer at any time
- to show network activity (rate of packets transmitted and received) at a network interface on my computer
- to show file system usage for a user-selected file system mount directory — or for all the file systems known to a computer
In the first case, the Tk script was essentially a 'wrapper' for the 'free' command, which is available on my operating system (Ubuntu 9.10, 2009 October, 'Karmic Koala').
In the 2nd case, the Tk script was essentially a 'wrapper' for the 'netstat' (or 'ifconfig') command.
In the 3rd case, the Tk script was essentially a 'wrapper' for the 'df' command.
The code for the memory-and-swap application is on the wiki page titled A Pair of Tachometer-style Meters --- for Memory and Swap.
The code for the network-activity application is on the wiki page titled A Pair of Tachometer-style Meters --- for Network Activity.
The code for the file-system-usage application is on the wiki page titled A Tachometer-style Meter --- for File System Usage.
I had one other application of the 'tachometer style' meter on my 'to-do' list --- a CPU-usage monitoring application. That is the subject of this page.
---
Getting appropriate CPU activity data:
In doing web searches for ways to get CPU activity info on Linux, I found that the file '/proc/stat' has information on the one or more CPU's on a computer --- and one can see that information by using the 'cat' command. Example output ... from a computer with 2 CPU's :
   $ cat /proc/stat
   cpu  183112 1474 25701 1008114 5609 357 1301 0 0
   cpu0 96100 982 12954 469961 2710 77 88 0 0
   cpu1 87011 491 12746 538152 2898 280 1213 0 0
   intr 3118276 1241284 1838 0 0 0 0 0 0 1 17228 0 0 2573 0 0 0 869 62033 0 0 0 0 0 0 0 0 27446 59166 16612 0 0 0 0 0 0 0 0 0 0 0 0 0 0 0 0 0 0 0 0 0 0 0 0 0 0 0 0 0 0 0 0 0 0 0 0 0 0 0 0 0 0 0 0 0 0 0 0 0 0 0 0 0 0 0 0 0 0 0 0 0 0 0 0 0 0 0 0 0 0 0 0 0 0 0 0 0 0 0 0 0 0 0 0 0 0 0 0 0 0 0 0 0 0 0 0 0 0 0 0 0 0 0 0 0 0 0 0 0 0 0 0 0 0 0 0 0 0 0 0 0 0 0 0 0 0 0 0 0 0 0 0 0 0 0 0 0 0 0 0 0 0 0 0 0 0 0 0 0 0 0 0 0 0 0 0 0 0 0 0 0 0 0 0 0 0 0 0 0 0 0 0 0 0 0 0 0 0 0 0 0 0 0 0 0 0 0 0 0 0 0 0 0 0 0 0 0 0 0 0 0 0 0 0 0 0 0 0 0 0 0 0 0 0 0 0 0 0 0 0 0 0 0 0 0 0 0 0 0 0 0 0 0 0 0 0 0 0 0 0 0 0 0 0 0 0 0 0 0 0 0 0 0 0 0 0 0 0 0 0 0 0 0 0 0 0 0 0 0 0 0 0 0 0 0 0 0 0 0 0 0 0 0 0 0 0 0 0 0 0 0 0 0 0 0 0 0 0 0 0 0 0 0 0 0 0 0 0 0 0 0 0 0 0 0 0 0 0 0 0 0 0 0 0 0 0 0 0 0 0 0 0 0 0 0 0 0 0 0 0 0 0 0 0 0 0 0 0 0 0 0 0 0 0 0 0 0 0 0 0 0 0 0 0 0 0 0 0 0 0 0 0 0 0 0 0 0 0 0 0 0 0 0 0 0 0 0 0 0 0 0 0 0 0 0 0 0 0 0 0 0 0 0 0 0 0 0 0 0 0 0
   ctxt 4455035
   btime 1378614163
   processes 2381
   procs_running 2
   procs_blocked 0
   softirq 1569874 0 1120419 10859 10176 27466 4934 307011 551 88458
This output is explained via the 'man proc' command. See the section that starts at '/proc/stat'.
The first 4 numbers on each 'cpu' line are the amount of time --- measured in units of USER_HZ (approx. 1/100ths of a second on most architectures) --- that the system spent in
   1) user mode,
   2) user mode with low priority ('nice' mode),
   3) system mode,
   4) the idle task,
respectively. The other numbers on each 'cpu' line are described in 'man proc'. The time is measured from boot time. The output from two consecutive queries can be used to get the cpu-activity (user,nice,system,idle) over a sample time interval.
The 'cat /proc/stat' command is used to show the CPU 'ticks' --- sometimes called 'jiffies', which are on the order of 1/100th of a second --- in the categories user-nice-system-idle-etc --- for ALL the CPU's of the computer --- as well as totals for all the CPU's.
Although Unix and BSD systems have many commands --- like 'free' and 'netstat' and 'df' --- that behave almost exactly as they do on Gnu/Linux, the characteristics of the '/proc' file system of Linux may be rather unique. In other words, to get the following utility to work, one may have to substitute another command wherever the 'cat /proc/stat' command is used.
That command is used in 3 places in a shell script (code shown below). The Tk script, whose code is shown below, serves as a GUI 'wrapper' or 'front end' for that shell script.
Note that the Apple Mac operating system is based on a BSD system, so if there is a suitable command on BSD systems to get the 'cat /proc/stat' data --- then it may be possible to implement this 'CPU-usage' utility on Apple Mac systems with just a few changes.
Summarizing: This utility is probably usable on BSD and Mac (and Unix) systems with some changes to the shell script. And for almost any Linux system with an 8.x Tcl-Tk 'wish' interpreter installed, this utility should be usable with essentially no changes.
---
The number of 'cpu*' lines:
In the example output above, you can see that there are 3 CPU's listed --- 'cpu', 'cpu0', and 'cpu1'. The data for 'cpu' are totals of the data for the CPU's 'cpu0' and 'cpu1'.
On a home computer with just one CPU, there may be only one CPU-ID in the listing --- 'cpu'. I don't know for sure myself because my little netbook computers have at least 2 CPU's (cpu0,cpu1) and my main desktop computer has 4 CPU's (cpu0,cpu1,cpu2,cpu3).
Designing the Tk GUI
I decided to go with a single meter on the GUI --- rather than 2 meters, like in the 'memory-and-swap' and the 'network-activity' Tk GUI's that I had devised before.
In fact, I patterned this GUI on the single-meter GUI that I used for the 'file-system-usage' Tk GUI that I devised before.
Besides showing a 'percent-usage' meter (on a Tk canvas on the GUI), I wanted to provide a means for the user to query the CPU ID's available on the computer --- and to choose one of the CPU-ID's to monitor.
And I wanted to provide a Tk 'scale' widget on the GUI, by which the user can specify, at any time, a new 'sampling rate' --- for getting the CPU-activity data via the 'cat /proc/stat' command. (Actually, the 'sampling rate' is a 'wait-time' = 'wave-length', rather than a 'frequency'.)
I was able to implement that periodic-sampling ability by use of the Tcl 'after' command, in the form
after $WAITmillisecs update_needles
This command is issued once to initialize the GUI --- and it is issued within the 'update_needles' proc itself, to continue getting CPU usage data, for a user-specified CPU-ID, via the 'cat /proc/stat' command.
Since, often, the 'ticks' for any of the CPU's are accumulating rather gradually, a sampling rate of at least a couple of seconds is needed to get reasonably accurate %-usage for the low-usage CPU's. So the scale is initialized at a rate of that magnitude.
And since any computer, even one with only one CPU, will probably have the CPU-ID 'cpu' included in the output of 'cat /proc/stat', I decided to initialize the monitoring with the CPU-ID 'cpu'.
I also wanted to supply a 'Refresh' button on the GUI, so that the user can request at ANY TIME, a new query of the usage data for the CPU-ID being monitored. This is especially helpful if you have the sampling rate set at 10 seconds or more, and you want to intervene immediately to change the sampling rate.
And, in case there is more than one CPU that is quite active, I wanted to supply a 'Report' button on the GUI, so that the user can see, at any time, the usage of ALL the CPU's on the computer --- even a monster computer with 24 or more CPU's.
In putting together the code for this GUI, I drew heavily on the 'shadow-circle' technique of Marco Maggi to make nice looking meters. And I included a 'red-line' (danger) area on the meter, like he did.
One rather unique thing about this implementation of the meter (something not done by Maggi in his demo) is that the GUI window and the canvas and the meter are resizable. In other words, I spent quite a bit of effort in converting Maggi's procs
- FROM using hard-coded numbers for making the meters and their needles
- TO using variables that are set based on a query on the current size of a frame or canvas widget.
So the user is able to resize the window and click on the 'Refresh' button to get a bigger version of the meter and the needle position.
SOME GUI IMAGES
On the basis of these goals, I ended up with the GUI seen in the following image.
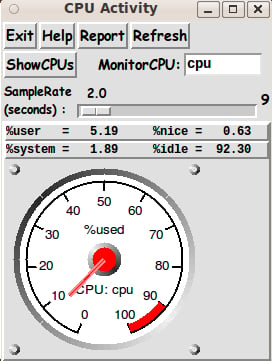
Typically, there are not many 'ticks' accumulating in 'nice mode'. So most of the 'activity' of a CPU is accumlating in the 'user' and 'system' modes.
I show the '%user' and '%system' numbers stacked above each other in a couple of 'label' widget lines on the GUI. Their sum will typically be the same as the %CPU value pointed to by the needle.
---
The integer shown just to the right of the 'scale' widget is a sample-count. I found that it is helpful to have this count displayed in cases when the needle and numbers on the GUI are not changing perceptibly --- so that the user is assured that the sampling is taking place, and at the rate that is currently requested.
---
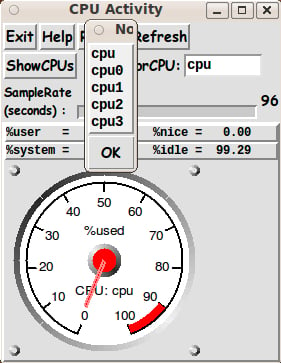
The 'ShowCPUs' button on the GUI can be used to show the available CPU-ID's. A small window pops up showing a list of CPU-ID's --- as seen in the following image.
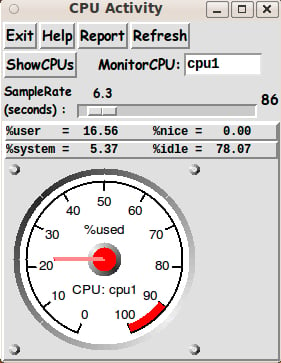
Below is an image that shows that one can change the 'MonitorCPU' entry field so that a different CPU-ID is monitored --- in this case the CPU-ID 'cpu1' --- the second of four CPU's on my desktop computer.
When the GUI first comes up, the meter (its canvas) is sized at about 200x200 pixels --- and the data shown is based on an initial couple of executions of the 'cat /proc/stat' command --- from which data for the 'cpu' CPU-ID is extracted.
The image below demonstrates that the user is able to resize the window and click on the 'Refresh' button to get a bigger version of the meter.
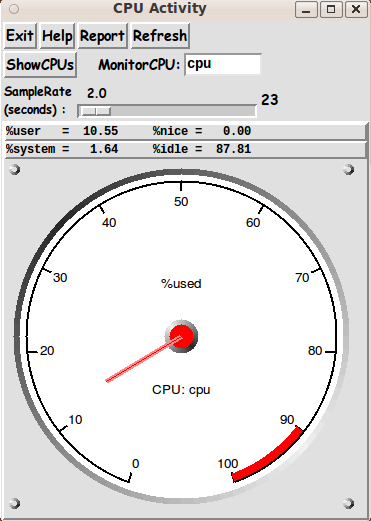
I had hoped to come up with a technique to avoid the 'aliasing' effect on the needles --- but I did not devise a successful technique for any of the 4 tachometer-meter scripts that I have done so far.
However, as 'retina display' monitors come into use more and more (with resolutions above about 2000x1500 pixels), even without changing the needle-drawing code in this script, you may find that the 'jaggies' are hard to see. (I do not have such a monitor yet, so I cannot say for sure.)
CAPTURING THE GENERATED IMAGE:
When you get an image that you want to save, a screen/window capture utility (like 'gnome-screenshot' on Linux) can be used to capture the GUI image in a PNG or GIF file, say.
If necessary, an image editor (like 'mtpaint' on Linux) can be used to crop the window capture image. (The image could also be down-sized with the editor --- say, to make a smaller image suitable for presentation in an email or on a web page.)
This is the technique that I used to prepare the images that I posted above, to show some GUI features of this utility. However, I replaced the relatively large PNG files that came from the 'mtpaint' editing step with smaller JPEG files that were created by the ImageMagick 'convert' command.
The code
Below, I provide the Tk script code for this 'CPU-usage' display utility.
I follow my usual 'canonical' structure for Tk code for this Tk script:
  0) Set general window & widget parms (win-name, win-position,
     win-color-scheme, fonts, widget-geometry-parms, win-size-control,
     text-array-for-labels-etc).

  1a) Define ALL frames (and sub-frames, if any).
  1b) Pack   ALL frames and sub-frames.

  2) Define & pack all widgets in the frames, frame by frame.
              Within each frame, define ALL the widgets.
              Then pack the widgets.

  3) Define keyboard and mouse/touchpad/touch-sensitive-screen action
     BINDINGS, if needed.

  4) Define PROCS, if needed.

  5) Additional GUI initialization (typically with one or more of
     the procs), if needed.
This Tk coding structure is discussed in more detail on the page A Canonical Structure for Tk Code --- and variations.
This structure makes it easy for me to find code sections --- while generating and testing a Tk script, and when looking for code snippets to include in other scripts (code re-use).
I call your attention to step-zero. One thing that I have started doing in 2013 is using a text-array for text in labels, buttons, and other widgets in the GUI. This can make it easier for people to internationalize my scripts. I will be using a text-array like this in most of my scripts in the future.
Experimenting with the GUI
As in all my scripts that use the 'pack' geometry manager (which is all of my 100-plus scripts, so far), I provide the four main pack parameters --- '-side', '-anchor', '-fill', '-expand' --- on all of the 'pack' commands for the frames and widgets.
That helps me when I am initially testing the behavior of a GUI (the various widgets within it) as I resize the main window.
I think that I have used a pretty nice choice of the 'pack' parameters. The label and button widgets stay fixed in size and relative-location if the window is re-sized --- while the canvas area (without scroll bars) expands/contracts whenever the window is re-sized, and the 'Refresh' button is clicked.
The meter expands/contracts when the window is re-sized --- but perhaps not always in a way you would desire. Occasionally, you may need to tug the borders of the window to show the meter in a way that suits you.
You can experiment with the '-side', '-anchor', '-fill', and '-expand' parameters on the 'pack' commands for the various frames and widgets --- to get the widget behavior that you want.
And you can look into the code that is drawing the meter to see if you can devise meter-resizing behavior that pleases you more.
___
Additional experimentation: You might want to change the fonts used for the various GUI widgets. For example, you could change '-weight' from 'bold' to 'normal' --- or '-slant' from 'roman' to 'italic'. Or change font families.
In fact, you may NEED to change the font families, because the families I used may not be available on your computer --- and the default font that the 'wish' interpreter chooses may not be very pleasing.
I use variables to set geometry parameters of widgets --- parameters such as border-widths and padding. And I have included the '-relief' parameter on the definitions of frames and widgets. Feel free to experiment with those 'appearance' parameters as well.
If you find the gray 'palette' of the GUI is not to your liking, you can change the value of the RGB parameter supplied to the 'tk_setPalette' command near the top of the code.
Some features in the code
That said, here's the code --- with plenty of comments to describe what most of the code-sections are doing.
You can look at the top of the PROCS section of the code to see a list of the procs used in this script, along with brief descriptions of how they are called and what they do.
The main procs are
   'make_tachometers' - to draw one (or more) meters within their Tk (square) canvases.

                        We allow the canvas(es) to resize according to
                        a resizing of the window. This proc will set the
                        SQUARE size of the canvas(es) according to the current
                        size of the frame containing the canvas(es).

   'make_one_tachometer' - called by 'make_tachometers', to make each meter.

                           In this utility, we draw only one meter --- but the
                           procs are structured to facilitate adding another
                           meter, if a Tcl-Tk coder so desired.

   'draw_rivet'          - called by 'make_one_tachometer', 4 times, to put
                           rivets in 4 corners around a meter.

   'draw_circle_shadow'  - called by 'make_one_tachometer' to put a shadowed
                           edge around the circle that makes the meter.
                           Also called to help make a 'pin' in the center of
                           the meter to hold the needle. Also called to make
                           the 4 rivets.

   'update_needles'      - to update the needle(s) on the meter(s).

   'update_one_needle'   - called by 'update_needles', to draw each needle.

   'Refresh'             - called by 'Refresh' button. Runs 'make_tachometers'
                           and 'update_needles'.

   'Report'              - called by 'Report' button.

   'show_cpus'           - called by 'ShowCPUs' button.

   'popup_msgVarWithScroll' - called by the 'Help' button, to show text in
                              variable $HELPtext. Also used by the 'Report'
                              and 'show_cpus' procs.
Thanks to Marco Maggi whose 'shadow-circle' drawing technique and code made this script much easier to write.
It is my hope that the copious comments in the code will help Tcl-Tk coding 'newbies' get started in making GUI's like this.
Without the comments, potential young Tcler's might be tempted to return to their iPhones and iPads and iPods --- to watch videos that have been selected by Daniel Tosh [L2 ] or his staff, for showing on his TV show, tosh.0 (tosh-point-zero).
Code for Tk script 'meters_cpu_usage.tk' : (the 'wrapper')
#!/usr/bin/wish -f
##+########################################################################
##
## SCRIPT: meters_cpus_usage.tk
##
## PURPOSE: This script is meant to show a GUI with a
## tachometer-style METER which shows the PERCENT-ACTIVITY
## of a CPU. The CPU could be one of several on a computer,
## or an average for all the CPU's of the computer.
##
## For a user-specified time interval, the sum of
## 'user', 'nice', 'system', and 'idle' times is found for
## a user-specified CPU. The sum of the first 3 times over the
## sum of the four is used to give the PERCENT-ACTIVITY of the CPU.
##
## This utility is designed for computer operating systems of the
## Linux/Unix/BSD type --- computers that have a '/proc/stat' (or
## similar) file that gives the user-nice-system-idle data for each
## cpu. This utility is also designed for computer operating
## systems that have commands like 'grep' and 'awk'.
##
## On computers with a single CPU, the meter simply shows an
## 'activity measure' for that one CPU.
##
## On computers with multiple CPU's, we default to showing
## an 'activity measure' for ALL the CPU's (i.e. an average
## for all the CPU's). And we allow the user to specify a
## particular CPU whose 'activity' is shown on the meter.
##
## We could allow MULTIPLE METERS to be shown --- say 4 ---
## showing %-user, %-nice, %-system, and %-idle --- for
## a user-specified CPU. But ...
##
## To simplify, we show just ONE METER (for a user-specified
## CPU) --- with the %-user+nice+system (the 'activity')
## being shown.
##
## When the GUI first appears, the meter will show the %-activity
## for the 'average CPU' (the sum of the CPU's).
##
## Of course, a Tcl-Tk programmer could change this script to
## initially show a single meter for the 'average' CPU --- AND the
## GUI could be implemented to allow the user to show 4 meters, say
## (user,nice,system,idle) for the initial 'average' CPU.
## Further, the user could change from the 'average' CPU to any of
## the individual CPU's. But ...
##
## For relative simplicity of coding, we stay with a single
## meter showing %-user+nice+system --- not multiple meters
## showing %-user, %-nice, %-system, %-idle for a given CPU.
##
## USAGE of a USER-SPECIFIED CPU:
##
## This script was developed on Linux and uses 'cat /proc/stat'
## to get 'activity' data for individual CPU's and for the
## 'total'/'average' CPU.
##
## A pop-out menu of the available CPU's is provided via a button
## on the GUI. Thus the user can select the CPU whose %-activity
## is shown on the meter.
##
## A red-line area of the meter indicates when the
## %-activity gets above about 85% or 90%.
##
## The %-user and %-system is also shown as text just above
## the meter.
##
## AUTO-UPDATE of the METER-NEEDLE and TEXT-DATA for the CPU:
##
## The needle on the meter is updated periodically to
## show the percent-activity for the user-selected CPU.
##
## The amount of time between updates is controlled by a
## scale widget on the GUI --- defaulted to about 5 seconds,
## say. And a 'Refresh' button on the GUI can be used to
## reset the start time for sampling --- at the current
## rate (sampling interval, set via the scale widget).
##
## A 'REPORT' OPTION:
##
## The 'cat /proc/stat' command can be used to show all the
## CPU 'ticks' (a.k.a. 'jiffies' - about 1/100th of a second) data,
## for ALL the CPU's of the computer.
##
## The user can click on a 'Report' button on the
## GUI to show the report in a pop-up scrollable Tk text widget.
## The user can copy-paste the text from that window to another
## window such as a text editor window or a word processor window.
##
## EXAMPLE 'cat /proc/stat' OUTPUT ... from a computer with 2 CPU's :
##
## $ cat /proc/stat
## cpu 183112 1474 25701 1008114 5609 357 1301 0 0
## cpu0 96100 982 12954 469961 2710 77 88 0 0
## cpu1 87011 491 12746 538152 2898 280 1213 0 0
## intr 3118276 1241284 1838 0 0 0 0 0 0 1 17228 0 0 2573 0 0 0 869 62033 0 0 0 0 0 0 0 0 27446 59166 16612 0 0 0 0 0 0 0 0 0 0 0 0 0 0 0 0 0 0 0 0 0 0 0 0 0 0 0 0 0 0 0 0 0 0 0 0 0 0 0 0 0 0 0 0 0 0 0 0 0 0 0 0 0 0 0 0 0 0 0 0 0 0 0 0 0 0 0 0 0 0 0 0 0 0 0 0 0 0 0 0 0 0 0 0 0 0 0 0 0 0 0 0 0 0 0 0 0 0 0 0 0 0 0 0 0 0 0 0 0 0 0 0 0 0 0 0 0 0 0 0 0 0 0 0 0 0 0 0 0 0 0 0 0 0 0 0 0 0 0 0 0 0 0 0 0 0 0 0 0 0 0 0 0 0 0 0 0 0 0 0 0 0 0 0 0 0 0 0 0 0 0 0 0 0 0 0 0 0 0 0 0 0 0 0 0 0 0 0 0 0 0 0 0 0 0 0 0 0 0 0 0 0 0 0 0 0 0 0 0 0 0 0 0 0 0 0 0 0 0 0 0 0 0 0 0 0 0 0 0 0 0 0 0 0 0 0 0 0 0 0 0 0 0 0 0 0 0 0 0 0 0 0 0 0 0 0 0 0 0 0 0 0 0 0 0 0 0 0 0 0 0 0 0 0 0 0 0 0 0 0 0 0 0 0 0 0 0 0 0 0 0 0 0 0 0 0 0 0 0 0 0 0 0 0 0 0 0 0 0 0 0 0 0 0 0 0 0 0 0 0 0 0 0 0 0 0 0 0 0 0 0 0 0 0 0 0 0 0 0 0 0 0 0 0 0 0 0 0 0 0 0 0 0 0 0 0 0 0 0 0 0 0 0 0 0 0 0 0 0 0 0 0 0 0 0 0 0 0 0 0 0 0 0 0 0 0 0 0 0 0 0 0 0 0 0 0 0 0 0 0 0 0 0 0 0 0 0 0 0 0 0
## ctxt 4455035
## btime 1378614163
## processes 2381
## procs_running 2
## procs_blocked 0
## softirq 1569874 0 1120419 10859 10176 27466 4934 307011 551 88458
##
## This output is explained via the 'man proc' command. See the section
## that starts '/proc/stat'.
##
## The first 4 numbers on each 'cpu' line are the amount of time, measured
## in units of USER_HZ (approx. 1/100ths of a second on most architectures)
## that the system spent in
## 1) user mode,
## 2) user mode with low priority (nice),
## 3) system mode,
## 4) the idle task,
## respectively. The other numbers on each 'cpu' line are described below.
## The time is measured from boot time. The output from two consecutive
## queries can be used to get the cpu-activity (user,nice,system,idle)
## over a sample time interval.
##
## In the above example of 2 CPU's (plus the 'total/average CPU'), we use
## the 1st 4 of the 9 columns of data in the 3 lines starting with 'cpu',
## 'cpu0', and 'cpu1'.
##
## The data for 'cpu' is the combined data for 'cpu0' and 'cpu1'.
## The 4th colum is 'idle time' in 'jiffies' (approx. hundredths of
## seconds). Column 4 usually contains most of the 'jiffies'.
##
## The data in the 9 columns is 'jiffies' due to
##
## 1 * user: normal processes executing in user mode
## 2 * nice: niced processes executing in user mode
## 3 * system: processes executing in kernel mode
## 4 * idle: twiddling thumbs
## 5 * iowait: waiting for I/O to complete
## 6 * irq: servicing interrupts
## 7 * softirq: servicing softirqs
## 8 * 'steal_time' - the ticks spent executing other virtual hosts
## (in virtualised environments like Xen)
## 9 * ticks spent on (virtual) guest systems.
##
## We calculate the %-usage of a CPU by calculating a numerator and
## a denominator. For the numerator, we could sum all of the 9 columns
## except column 4. For the denominator we could use the sum of all 9
## columns.
##
## Rather than using all 9 columns, we follow what others have done
## before and use the 1st 4 columns: user, nice, system, and idle.
##
## The needle on the meter is updated periodically to show the
## %-activity of the user-specified C, where %-activity means
##
## col1+col2+col3 / col1+col2+col3+col4.
##
## Of course, a Tcl-Tk coder could change calculations in this
## utility to use 9, rather than 4, columns of data.
##
##+################
## GUI DESCRIPTION:
##
## This script provides a Tk GUI with the following widgets.
##
## 1) There is an 'fRbuttons' frame to hold BUTTONS such as
## 'Exit' 'Help' 'Report' buttons. In addition, there is a
## 'Refresh' button --- to issue the 'cat /proc/stat' command
## and update the needle display on the meter according
## to the latest data sample.
##
## 2) In an 'fRcontrol1' frame, below the 'fRbuttons' frame,
## there is a 'ShowCPUs' button to show the user the list
## of available CPU's. Next to that button is an
## entry widget in which to enter a CPU ID. That CPU
## is the one whose %-activity is shown on the meter.
##
## 3) In an 'fRcontrol2' frame, below the 'fRcontrol1' frame,
## there is a SCALE widget ---
## for the user to set a 'wait-seconds' for auto-refresh of
## the meter data. The 'wait' may be in seconds --- down to
## tenths of seconds, and up to multiple minutes. The scale
## could be set to an initial value for the auto-refresh
## --- say, an initial value of 5 seconds.
##
## 4) There is an 'fRmeters' frame to contain a CANVAS widget
## that holds the meter image, in a SQUARE canvas.
## (Someday, we may wish to put more meters in the
## 'fRmeters' frame --- to show percent-activity for 'user'
## 'system' and other processing.)
##
## The 'fRmeters' frame also holds some LABEL widgets, to show
## %-user and %-system (and perhaps %-nice and %idle), as
## text items --- for the user-selected CPU.
##
##+################################
## METHOD USED to update the meter(s):
##
## A Tcl 'exec' command calls on a separate shell script that uses
## the 'cat /proc/stat' command to get the CPU usage data
## and reformat the data somehat for return to this Tk script.
##
## The shell script will be capable of returning info of 3 types:
## 1) activity data for ALL the CPU's (since boot time)
## 2) a list of the CPU's
## 3) activity data for a user-specified CPU (since boot time).
##
##+#######################
## CAPTURING THE GUI IMAGE:
##
## A screen/window capture utility (like 'gnome-screenshot'
## on Linux) can be used to capture the GUI image in a PNG
## or GIF file, say.
##
## If necessary, an image editor (like 'mtpaint' on Linux)
## can be used to crop the window capture image. The image
## could also be down-sized --- say to make a smaller image
## suitable for use in a web page or an email.
##
##+#######################################################################
## 'CANONICAL' STRUCTURE OF THIS CODE:
##
## 0) Set general window parms (win-name, win-position, win-color-scheme,
## fonts, widget-geom-parms, win-size-control, text-array-for-labels-etc).
##
## 1a) Define ALL frames (and sub-frames, if any).
## 1b) Pack the frames.
##
## 2) Define & pack all widgets in the frames, frame by frame.
## After all the widgets for a frame are defined, pack them in the frame.
##
## 3) Define keyboard or mouse/touchpad/touch-sensitive-screen 'event'
## BINDINGS, if needed.
##
## 4) Define PROCS, if needed.
##
## 5) Additional GUI INITIALIZATION (typically with one or more of
## the procs), if needed.
##
##+#################################
## Some detail of the code structure of this particular script:
##
## 1a) Define ALL frames:
##
## Top-level :
## '.fRbuttons' - to contain 'Exit', 'Help', 'Report', 'Refresh' buttons
## '.fRcontrol1' - to contain a 'ShowCPUs' button --- and an entry widget
## '.fRcontrol2' - to contain a scale widget, with a label widget.
## '.fRmeters' - to contain square canvas widget(s), which will display
## the the meter --- and perhaps more meters someday.
##
## Sub-frames:
## '.fRmeters.fRmeter1' - for 2 (or more) label widgets & 1 canvas widget
##
## 1b) Pack ALL frames.
##
## 2) Define & pack all widgets in the frames -- basically going through
## frames & their interiors in left-to-right, or top-to-bottom order.
##
## 3) Define BINDINGS: perhaps one or two
##
## 4) Define PROCS:
##
## 'make_tachometers' - to draw up to one (or more) meter(s) within
## Tk (square) canvas(es).
##
## We may allow the canvas(es) to resize according to
## a resizing of the window. This proc will set the
## SQUARE size of the canvases according to the current
## size of the frame containing the canvases. That
## frame will be allowed to expand if the user
## expands the entire GUI window.
##
## 'make_one_tachometer' - called by 'make_tachometers', to make each meter.
##
## 'draw_rivet' - called by 'make_one_tachometer', 4 times, to put
## rivets in 4 corners around a meter.
##
## 'draw_circle_shadow' - called by 'make_one_tachometer' to put a shadowed
## edge around the circle that makes the meter.
## Also called to help make a 'pin' in the center of
## the meter to hold the needle. Also called,
## in 'draw_rivet', to make each of the rivets.
##
## 'update_needles' - to update the needles on the one or more meters.
##
## 'update_one_needle' - called by 'update_needles', to draw the
## needle on each meter.
##
## 'Refresh' - called by 'Refresh' button. Runs
## 'make_tachometers' and 'update_needles'.
##
## 'Report' - called by 'Report' button.
##
## 'show_cpus' - called by 'ShowCPUs' button.
##
## 'popup_msgVarWithScroll' - called by 'Help' button to show HELPtext var.
## Also used by the 'Report' button and the
## 'ShowCPUs' button.
##
## 5) Additional GUI Initialization:
## - call 'make_tachometers' to put the meter(s) in the canvas(es).
## - call 'update_needles' --- to initialize the needle location(s).
##
##+#######################################################################
## DEVELOPED WITH: Tcl-Tk 8.5 on Ubuntu 9.10 (2009-october, 'Karmic Koala')
##
## $ wish
## % puts "$tcl_version $tk_version"
##
## showed
## 8.5 8.5
## but this script should work in most previous 8.x versions, and probably
## even in some 7.x versions (if font handling is made 'old-style').
##+#######################################################################
## MAINTENANCE HISTORY:
## Started by: Blaise Montandon 2013sep08 Started the basic code of the
## script based on my previous
## meters scripts, which use the
## 'shadow-circle' technique of
## a demo script by Marco Maggi
## at https://wiki.tcl-lang.org/9107
## Changed by: Blaise Montandon 2013nov21 Continued the coding on Linux,
## Ubuntu 9.10 after deciding to
## use one meter and allow the
## user to choose which CPU
## will be monitored with the meter.
## Changed by: Blaise Montandon 2013nov27 Develop and test all code except
## the 'Report' proc.
## Changed by: Blaise Montandon 2013dec04 Develop the 'Report' proc and
## the external shell script that
## is called by the 'Report' proc.
##+########################################################################
##+######################################################
## Set WINDOW TITLE and POSITION.
##+######################################################
wm title . "CPU Activity"
wm iconname . "CPU use"
wm geometry . +15+30
##+######################################################
## Set the COLOR SCHEME for the window and its widgets ---
## such as listbox and entry field background color.
##+######################################################
tk_setPalette "#e0e0e0"
# set listboxBKGD "#ffffff"
set entryBKGD "#ffffff"
set scaleBKGD "#f0f0f0"
set textBKGD "#f0f0f0"
##+########################################################
## DEFINE (temporary) FONT NAMES.
##
## We use a VARIABLE-WIDTH font for text on LABEL and
## BUTTON widgets.
##
## We use a FIXED-WIDTH font for LISTBOX lists,
## for text in ENTRY fields --- and often for text in
## TEXT widgets.
##+########################################################
font create fontTEMP_varwidth \
-family {comic sans ms} \
-size -14 \
-weight bold \
-slant roman
font create fontTEMP_SMALL_varwidth \
-family {comic sans ms} \
-size -12 \
-weight bold \
-slant roman
## Some other possible (similar) variable width fonts:
## Arial
## Bitstream Vera Sans
## DejaVu Sans
## Droid Sans
## FreeSans
## Liberation Sans
## Nimbus Sans L
## Trebuchet MS
## Verdana
font create fontTEMP_fixedwidth \
-family {liberation mono} \
-size -14 \
-weight bold \
-slant roman
font create fontTEMP_SMALL_fixedwidth \
-family {liberation mono} \
-size -12 \
-weight bold \
-slant roman
## Some other possible fixed width fonts (esp. on Linux):
## Andale Mono
## Bitstream Vera Sans Mono
## Courier 10 Pitch
## DejaVu Sans Mono
## Droid Sans Mono
## FreeMono
## Nimbus Mono L
## TlwgMono
##+###########################################################
## SET GEOM VARS FOR THE VARIOUS WIDGET DEFINITIONS.
## (e.g. width and height of canvas, and padding for Buttons)
##+###########################################################
## CANVAS widget geom settings:
set initCanWidthPx 200
set initCanHeightPx 200
# set BDwidthPx_canvas 2
set BDwidthPx_canvas 0
## LABEL widget geom settings:
set PADXpx_label 0
set PADYpx_label 0
set BDwidthPx_label 2
## BUTTON widget geom settings:
set PADXpx_button 0
set PADYpx_button 0
set BDwidthPx_button 2
## ENTRY widget geom settings:
set BDwidthPx_entry 2
## SCALE widget geom parameters:
set BDwidthPx_scale 2
set scaleThicknessPx 10
##+######################################################################
## Set a MIN-SIZE of the window (roughly).
##
## For WIDTH, allow for the min-width of the '.fRbuttons' frame
## --- the several button widgets in the 'fRbuttons' frame.
##
## For HEIGHT, allow for the stacked frames:
## 1 char high for the '.fRbuttons' frame,
## 1 char high for the '.fRcontrol1' frame,
## 2 chars high for the '.fRcontrol2' frame,
## at least 50 pixels high for the '.fRmeters' frame.
##+#####################################################################
## FOR WIDTH:
set minWidthPx [font measure fontTEMP_varwidth \
" Exit Help Report Refresh "]
## We add some pixels to account for right-left-size of
## window-manager decoration (~8 pixels) and some pixels for
## frame/widget borders (~4 widgets x 4 pixels/widget = 16 pixels).
set minWinWidthPx [expr {24 + $minWidthPx}]
## For HEIGHT --- for
## 1 char high for 'fRbuttons'
## 1 char high for 'fRcontrol1'
## 2 chars high for 'fRcontrol2'
## ~50 pixels high for 'fRmeters'
set charHeightPx [font metrics fontTEMP_varwidth -linespace]
set minWinHeightPx [expr {4 * $charHeightPx}]
## Add about 50 pixels for height of the canvas
## AND add about 20 pixels for top-bottom window decoration --
## and some pixels for top-and-bottom of frame/widget borders
## (~4 widgets x 4 pixels/widget = 16 pixels).
set minWinHeightPx [expr {86 + $minWinHeightPx}]
## FOR TESTING:
# puts "minWinWidthPx = $minWinWidthPx"
# puts "minWinHeightPx = $minWinHeightPx"
wm minsize . $minWinWidthPx $minWinHeightPx
## We may allow the window to be resizable. We pack the canvases
## (and the frames that contain them) with '-fill both -expand 1'
## so that the canvases can be enlarged by enlarging the window.
## If you want to make the window un-resizable,
## you can use the following statement.
# wm resizable . 0 0
##+##############################################################
## Set a TEXT-ARRAY to hold text for buttons & labels on the GUI.
## NOTE: This can aid INTERNATIONALIZATION. This array can
## be set according to a nation/region parameter.
##+##############################################################
## if { "$VARlocale" == "en"}
## For '.fRbuttons' frame:
set aRtext(buttonEXIT) "Exit"
set aRtext(buttonHELP) "Help"
set aRtext(buttonREPORT) "Report"
set aRtext(buttonREFRESH) "Refresh"
## For '.fRcontrol1' frame:
set aRtext(buttonCPUS) "ShowCPUs"
set aRtext(labelCPU) " MonitorCPU:"
## For '.fRcontrol2' frame:
set aRtext(labelSCALE) "SampleRate
(seconds) :"
## END OF if { "$VARlocale" == "en"}
##+################################################################
## DEFINE-AND-PACK *ALL* THE FRAMES:
##
## Top-level : '.fRbuttons', '.fRcontrol1', '.fRcontrol2', '.fRmeters'
##
## Sub-frames: '.fRmeters.fRmeter1' one meter, for now.
##+################################################################
## FOR TESTING: (to see size of frames as window is resized)
# set BDwidth_frame 2
# set RELIEF_frame raised
set BDwidth_frame 0
set RELIEF_frame flat
frame .fRbuttons -relief $RELIEF_frame -bd $BDwidth_frame
frame .fRcontrol1 -relief $RELIEF_frame -bd $BDwidth_frame
frame .fRcontrol2 -relief $RELIEF_frame -bd $BDwidth_frame
frame .fRmeters -relief $RELIEF_frame -bd $BDwidth_frame
##+##########################################################
## SUB-FRAME DEFINITIONS:
##+##########################################################
set MAXmeters 1
# set MAXmeters 4
frame .fRmeters.fRmeter1 -relief raised -bd 2
# frame .fRmeters.fRmeter2 -relief raised -bd 2
# frame .fRmeters.fRmeter3 -relief raised -bd 2
# frame .fRmeters.fRmeter4 -relief raised -bd 2
##+##############################
## PACK the top-level FRAMES.
##+##############################
pack .fRbuttons \
-side top \
-anchor nw \
-fill x \
-expand 0
pack .fRcontrol1 \
-side top \
-anchor nw \
-fill x \
-expand 0
pack .fRcontrol2 \
-side top \
-anchor nw \
-fill x \
-expand 0
pack .fRmeters \
-side top \
-anchor nw \
-fill both \
-expand 1
##+###################################################
## We pack a single canvas sub-frame (meter), for now.
##
## Someday we may allow for at least two meters.
##+###################################################
pack .fRmeters.fRmeter1 \
-side left \
-anchor nw \
-fill both \
-expand 1
##+##########################################################
## The FRAMES ARE PACKED. START PACKING WIDGETS IN THE FRAMES.
##+##########################################################
##+##########################################################
## In FRAME '.fRbuttons' -
## DEFINE-and-PACK 'BUTTON' WIDGETS
## --- Exit, Help, Refresh, Report BUTTONS.
##+##########################################################
button .fRbuttons.buttEXIT \
-text "$aRtext(buttonEXIT)" \
-font fontTEMP_varwidth \
-padx $PADXpx_button \
-pady $PADYpx_button \
-relief raised \
-bd $BDwidthPx_button \
-command {exit}
button .fRbuttons.buttHELP \
-text "$aRtext(buttonHELP)" \
-font fontTEMP_varwidth \
-padx $PADXpx_button \
-pady $PADYpx_button \
-relief raised \
-bd $BDwidthPx_button \
-command {popup_msgVarWithScroll .topHelp "$HELPtext"}
button .fRbuttons.buttREPORT \
-text "$aRtext(buttonREPORT)" \
-font fontTEMP_varwidth \
-padx $PADXpx_button \
-pady $PADYpx_button \
-relief raised \
-bd $BDwidthPx_button \
-command {Report}
button .fRbuttons.buttREFRESH \
-text "$aRtext(buttonREFRESH)" \
-font fontTEMP_varwidth \
-padx $PADXpx_button \
-pady $PADYpx_button \
-relief raised \
-bd $BDwidthPx_button \
-command {Refresh}
## Pack the widgets in frame '.fRbuttons'.
pack .fRbuttons.buttEXIT \
.fRbuttons.buttHELP \
.fRbuttons.buttREPORT \
.fRbuttons.buttREFRESH \
-side left \
-anchor w \
-fill none \
-expand 0
##+##########################################################
## In FRAME '.fRcontrol1' -
## DEFINE-and-PACK a 'ShowCPUs' BUTTON, and
## a CPU-ID ENTRY widget.
##+##########################################################
## Here is the BUTTON for showing a list of CPU IDs.
button .fRcontrol1.buttCPUS \
-text "$aRtext(buttonCPUS)" \
-font fontTEMP_varwidth \
-padx $PADXpx_button \
-pady $PADYpx_button \
-relief raised \
-bd $BDwidthPx_button \
-command {show_cpus}
label .fRcontrol1.labelCPU \
-text "$aRtext(labelCPU)" \
-font fontTEMP_varwidth \
-justify left \
-anchor w \
-relief flat \
-padx $PADXpx_label \
-pady $PADYpx_label \
-bd $BDwidthPx_label
## Here is the ENTRY field for a CPU name.
## Set this widget var in the GUI initialization section
## at the bottom of this script.
# set CPUname "cpu"
entry .fRcontrol1.entryCPU \
-textvariable CPUname \
-bg $entryBKGD \
-font fontTEMP_fixedwidth \
-width 9 \
-relief sunken \
-bd $BDwidthPx_entry
## Pack the widgets in frame '.fRcontrol1'.
pack .fRcontrol1.buttCPUS \
.fRcontrol1.labelCPU \
.fRcontrol1.entryCPU \
-side left \
-anchor w \
-fill none \
-expand 0
##+##########################################################
## In FRAME '.fRcontrol2' -
## DEFINE-and-PACK a LABEL-AND-SCALE widget pair ---
## for changing the 'refresh rate' for the meter needle(s).
##+##########################################################
## Here is the LABEL-AND-SCALE pair for the wait-seconds (sample rate).
label .fRcontrol2.labelSCALE \
-text "$aRtext(labelSCALE)" \
-font fontTEMP_SMALL_varwidth \
-justify left \
-anchor w \
-relief flat \
-padx $PADXpx_label \
-pady $PADYpx_label \
-bd $BDwidthPx_label
## Set this widget var in the GUI initialization section
## at the bottom of this script.
# set WAITseconds 60
scale .fRcontrol2.scaleSECONDS \
-from 0.1 -to 120.0 \
-resolution 0.1 \
-font fontTEMP_SMALL_varwidth \
-variable WAITseconds \
-showvalue true \
-orient horizontal \
-bd $BDwidthPx_scale \
-length 180 \
-width $scaleThicknessPx
## Here is a label to show the current sample count.
label .fRcontrol2.labelCOUNT \
-textvariable VARsampcnt \
-font fontTEMP_varwidth \
-justify right \
-anchor w \
-relief flat \
-bd 0
## Pack the widgets in frame '.fRcontrol2'.
pack .fRcontrol2.labelSCALE \
.fRcontrol2.scaleSECONDS \
.fRcontrol2.labelCOUNT \
-side left \
-anchor w \
-fill none \
-expand 0
##+########################################################
## In FRAME '.fRmeters.fRmeter1' -
## DEFINE-and-PACK TWO LABELs and
## ONE CANVAS WIDGET (no scrollbars).
##
## We highlightthickness & borderwidth of the canvas to
## zero, as suggested on page 558, Chapter 37, 'The Canvas
## Widget', in the 4th edition of the book 'Practical
## Programming in Tcl and Tk'.
##+#######################################################
label .fRmeters.fRmeter1.labelINFO1 \
-text "" \
-font fontTEMP_SMALL_fixedwidth \
-justify left \
-anchor w \
-relief raised \
-padx $PADXpx_label \
-pady $PADYpx_label \
-bd $BDwidthPx_label
label .fRmeters.fRmeter1.labelINFO2 \
-text "" \
-font fontTEMP_SMALL_fixedwidth \
-justify left \
-anchor w \
-relief raised \
-padx $PADXpx_label \
-pady $PADYpx_label \
-bd $BDwidthPx_label
canvas .fRmeters.fRmeter1.can \
-width $initCanWidthPx \
-height $initCanHeightPx \
-relief flat \
-highlightthickness 0 \
-borderwidth 0
## Pack the widgets in frame '.fRmeters.fRmeter1'.
pack .fRmeters.fRmeter1.labelINFO1 \
.fRmeters.fRmeter1.labelINFO2 \
-side top \
-anchor nw \
-fill x \
-expand 0
pack .fRmeters.fRmeter1.can \
-side top \
-anchor nw \
-fill none \
-expand 0
##+##################################################
## END OF DEFINITION of the GUI widgets.
##+##################################################
## Start of BINDINGS, PROCS, Added-GUI-INIT sections.
##+##################################################
##+##################################################################
##+##################################################################
## BINDINGS SECTION:
##+##################################################################
bind .fRcontrol1.entryCPU <Return> {Refresh}
##+##################################################################
##+##################################################################
## DEFINE PROCS SECTION:
##
## 'make_tachometers' - to draw meter(s) within Tk (square) canvas(es).
##
## We may allow the Tk canvas(es) to resize according to
## a resizing of the window. This proc will draw the
## meter(s) with size based on the current size of the
## 'fRmeters' frame.
##
## 'make_one_tachometer' - to draw one tachometer. Called by 'make_tachometers'
## to make the meter(s).
##
## 'draw_rivet' - called by 'make_tachometers' to put rivets in 4
## corners around each meter.
##
## 'draw_circle_shadow' - called by 'make_tachometers' to put a shadowed
## edge around the circle that makes each meter.
## Also called by 'make_tachometers' to put
## a shadowed edge on the 'pin' that holds a needle.
## Also called by 'draw_rivet' to put a shadowed
## edge on each rivet.
##
## 'update_needles' - to update the needle(s) on the meter(s).
## Called initially at the bottom of this script.
## And called in the 'Refresh' proc.
##
## 'update_one_needle' - to draw one needle in a specified meter-canvas.
## Called by 'update_needles' to update each of the
## needles on the one or more meters.
##
## 'Refresh' - called by the 'Refresh' button. Runs the procs
## 'make_tachometers' and 'update_needles' --- in particular,
## for the user to force the meters to be resized if
## the user resizes the window --- and whenever the user
## wants a new 'reading'.
##
## 'Report' - called by the 'Report' button. This Report proc
## calls on the 'get_cpu_usage_info.sh' script
## with the 'all' parameter.
##
## 'show_cpus' - called by the 'ShowCPUs' button. This proc
## calls on the 'get_cpu_usage_info.sh' script
## with the 'cpuslist' parameter.
##
## 'popup_msgVarWithScroll' - to show the HELPtext var. Called by the 'Help' button.
## Also used by the 'Report' and 'ShowCPUs' procs.
##
##+#################################################################
##+########################################################################
## PROC 'make_tachometers'
##+########################################################################
## PURPOSE: Draws all features of one or more tachometer-style meters (except
## the needles) --- in a 'nice filling-size' according to the
## current canvas dimensions.
##
## (We will allow the canvas to resize according to
## a resizing of the window. This proc will redraw the
## meters in proportion to the new size of the canvas.)
##
## CALLED BY: once, at the 'Additional GUI Initialization' section,
## at the bottom of this script --- and
## in the 'Refresh' proc (which is called by the 'Refresh'
## button, for example, after the window is resized).
##+########################################################################
set Nmeters 1
proc make_tachometers {} {
global marginPx Nmeters
## FOR TESTING: (to dummy out this proc)
# return
############################################################
## Get current '.fRmeters' dimensions --- in case the user
## has resized the window, and thus the '.fRmeters' frame,
## which was packed with '-fill both -expand 1'.
############################################################
set curMetersFrameWidthPx [winfo width .fRmeters]
set curMetersFrameHeightPx [winfo height .fRmeters]
## Adjust height for 2 text lines in the '.fRmeters' frame
## for %-user and %-system processing activity for the
## user-specified CPU.
set charHeightPx [font metrics fontTEMP_SMALL_fixedwidth -linespace]
set curMetersFrameHeightPx \
[expr {$curMetersFrameHeightPx - (2 * $charHeightPx)}]
############################################################
## Set a width-and-height to use for each (square) canvas
## to contain the one (or more) meters.
## (We take ~10 pixels off the height to account for some
## borderwidths of frames within the 'fRmeters' frame.)
############################################################
# set meterSizePx [expr {int(($curMetersFrameWidthPx - 6) / $Nmeters)}]
# if {$curMetersFrameHeightPx < $meterSizePx} {set meterSizePx $curMetersFrameHeightPx}
set meterSizePx [expr {$curMetersFrameHeightPx - 12}]
####################################################################
## Resize the canvas(es) --- like '.fRmeters.fRmeter1.can' --- that
## hold the one (or more) square meters.
## Note that this/these canvases and their parent frames were all packed
## with '-fill both -expand 1' --- so if the canvas widgets
## expand/contract, then the parent frames should do the same.
####################################################################
# for {set i 1} {$i < $Nmeters} {incr i} {
# eval .fRmeters.fRmeter$i.can configure -width $meterSizePx
# eval .fRmeters.fRmeter$i.can configure -height $meterSizePx
# }
.fRmeters.fRmeter1.can configure -width $meterSizePx
.fRmeters.fRmeter1.can configure -height $meterSizePx
if {0} {
## Not needed?? Resizing the Tk canvases will determine the
## size of the 'parent' frames of the canvases??
for {set i 1} {$i < $Nmeters} {incr i} {
eval .fRmeters.fRmeter$i configure -width $meterSizePx
eval .fRmeters.fRmeter$i configure -height $meterSizePx
}
}
if {0} {
## Not needed?? Resizing the Tk canvases will determine the
## size of the 'parent' frames of the canvases??
set fullWidthPx [expr {($Nmeters * ($meterSizePx + 4)}]
.fRmeters configure -width $fullWidthPx
.fRmeters configure -height $meterSizePx
}
#####################################################
## NEEDED to force the canvases and frames to update
## according to the new canvas sizes.
#####################################################
update
#########################################################
## Draw the Nmeters meters (without their needles).
#########################################################
# for {set i 1} {$i < $Nmeters} {incr i} {
# eval make_one_tachometer .fRmeters.fRmeter$i.can
# }
#########################################################
## Draw meter1 (without needle).
#########################################################
make_one_tachometer .fRmeters.fRmeter1.can
}
## END OF proc 'make_tachometers'
##+########################################################################
## PROC 'make_one_tachometer'
##+########################################################################
## PURPOSE: Draws all features of a tachometer-style meter (except the
## needle) --- according to the 'marginPx' parameter to set
## top-right and bottom-left coordinates to specify the location
## of the square exactly containing the circular meter on
## the canvas whose ID is passed into this proc.
##
## The features include:
## - white-filled circle for the meter background
## - a gray-shaded (shadowed) edge around the circle
## - a 'pin' in the center of the circle, for the needle
## - 4 decorative rivets at the corners of the canvas
## - an arc with tic-marks
## - a red danger-zone in the last segment of the arc
## (between the last pair of tic-marks)
## - labels for the tic-marks
##
## CALLED BY: proc 'make_tachometers'
##+#######################################################################
## Set an 'indentation' to use for placing the outer-circle of meter(s)
## from the 4 edges of their respective canvases.
set marginPx 12
set pi [expr {4.0 * atan(1.0)}]
set radsPERdeg [expr {$pi/180.0}]
## The above variables are set ONCE, for use in the following proc.
## We may set the following tic-marks parms at the bottom
## of this script, in the 'Additional GUI Initialization' section.
# set Nsegs 10
# set ticLabels "0 10 20 30 40 50 60 70 80 90 100"
proc make_one_tachometer {canvas} {
global marginPx pi radsPERdeg Nsegs ticLabels
## FOR TESTING: (to dummy out this proc)
# return
################################################################
## Remove any previously drawn elements in this canvas, if any.
################################################################
catch {$canvas delete all}
##################################################################
## Get the width (= height) of the specified (square) canvas.
##################################################################
set curCanvasSizePx [winfo width $canvas]
##################################################################
## Set the corner coords for drawing the meter circle (background).
##################################################################
set topleftXpx $marginPx
set topleftYpx $marginPx
set botrightXpx [expr {$curCanvasSizePx - $marginPx}]
set botrightYpx [expr {$curCanvasSizePx - $marginPx}]
################################################
## Draw basic white-filled circle for the meter.
################################################
$canvas create oval \
$topleftXpx $topleftYpx $botrightXpx $botrightYpx \
-fill white -outline {}
# -width 1 -outline lightgray
## FOR TESTING: (exit this proc before adding more to the meter)
# return
#######################################################################
## Draw shadow-circle at the outer circle of the meter.
#######################################################################
## INPUTS:
## - the 4 corner coordinates of the oval/circle box (in pixels)
## - number of segments for the arc (segments of differing color shade)
## - width (in pixels) to draw the arc segments
## - start angle for drawing the (darker) arc segments
## (measured counter-clockwise from the 3 o'clock position)
## (An angle of +135=90+45 means the dark side of the 'shadow-circle'
## is on the north-west side of the circle.)
######################################################################
draw_circle_shadow $canvas \
$topleftXpx $topleftYpx $botrightXpx $botrightYpx \
40 6 135.0
## FOR TESTING: (exit this proc before adding more to the meter)
# return
###################################################################
## Draw a shadow-circle for the 'pin' of the meter needle.
###################################################################
## INPUTS:
## - the 4 corner coordinates of the oval/circle box (in pixels)
## - number of segments for the arc (segments of differing color shade)
## - width (in pixels) to draw the arc segments
## - start angle for drawing the (darker) arc segments
## (measured counter-clockwise from the 3 o'clock position)
## (An angle of -45 means the dark side of the 'shadow-circle'
## is on the south-east side of the circle.)
###################################################################
set centerXpx [expr {int($curCanvasSizePx/2.0)}]
set centerYpx $centerXpx
set pinOuterRadiusPx 14
set x1 [expr {$centerXpx - $pinOuterRadiusPx}]
set y1 [expr {$centerYpx - $pinOuterRadiusPx}]
set x2 [expr {$centerXpx + $pinOuterRadiusPx}]
set y2 [expr {$centerYpx + $pinOuterRadiusPx}]
draw_circle_shadow $canvas $x1 $y1 $x2 $y2 40 6 -45.0
## FOR TESTING: (exit this proc before adding more to the meter)
# return
## FOR TESTING:
# puts "proc 'make_one_tachometer'."
# puts "curCanvasSizePx: $curCanvasSizePx centerYpx: $centerYpx"
############################################################
## Draw a red-filled circle on the 'pin' of the meter needle.
############################################################
set pinRadiusPx 12
set x1 [expr {$centerXpx - $pinRadiusPx}]
set y1 [expr {$centerYpx - $pinRadiusPx}]
set x2 [expr {$centerXpx + $pinRadiusPx}]
set y2 [expr {$centerYpx + $pinRadiusPx}]
$canvas create oval \
$x1 $y1 $x2 $y2 -fill red -outline {}
# -width 1 -outline lightgray
## FOR TESTING: (exit this proc before adding more to the meter)
# return
###########################################
## Draw arc-line on which to put tic marks.
#################################################
## 320 degrees counter-clockwise from -70 degrees
## (based at 3 oclock) is 70 degrees beyond 180.
## I.e. -70 + 320 = 250 = 180 + 70
#################################################
set arcLineIndentPx 10
set x1 [expr {$topleftXpx + $arcLineIndentPx}]
set y1 [expr {$topleftYpx + $arcLineIndentPx}]
set x2 [expr {$botrightXpx - $arcLineIndentPx}]
set y2 [expr {$botrightYpx - $arcLineIndentPx}]
$canvas create arc $x1 $y1 $x2 $y2 \
-start -70 -extent 320 -style arc \
-outline black -width 2
## FOR TESTING: (exit this proc before adding more to the meter)
# return
##################################################
## Draw tic-marks and labels around the meter.
##################################################
set DEGperTIC [expr {320.0/$Nsegs}]
set half $centerXpx
## outer location (radius) of tic marks
set l1 [expr {$half - ($arcLineIndentPx + $marginPx)}]
## inner location (radius) of tic marks
set l2 [expr {$l1 - $arcLineIndentPx}]
## inner location of tic labels
set l3 [expr {$l2 - $arcLineIndentPx}]
set angle0 250.0
for {set i 0} {$i <= $Nsegs} {incr i} {
set rads [expr {($angle0 - ($DEGperTIC * $i)) * $radsPERdeg}]
set x1 [expr {$half + $l1 * cos($rads)}]
set y1 [expr {$half - $l1 * sin($rads)}]
set x2 [expr {$half + $l2 * cos($rads)}]
set y2 [expr {$half - $l2 * sin($rads)}]
$canvas create line \
$x1 $y1 $x2 $y2 \
-fill black -width 2
set x1 [expr {$half + $l3 * cos($rads)}]
set y1 [expr {$half - $l3 * sin($rads)}]
set label [lindex $ticLabels $i]
if { [string length $label] } {
$canvas create text \
$x1 $y1 \
-anchor center -justify center -fill black \
-text $label -font { Helvetica 10 }
}
## END OF labels loop.
}
## END OF i-loop for tic-marks
## FOR TESTING: (exit this proc before adding more to the meter)
# return
#######################################################
## Draw red-line arc-segment (danger zone) of the meter.
#######################################################
set redLineIndentPx 15
set x1 [expr {$topleftXpx + $redLineIndentPx}]
set y1 [expr {$topleftYpx + $redLineIndentPx}]
set x2 [expr {$botrightXpx - $redLineIndentPx}]
set y2 [expr {$botrightYpx - $redLineIndentPx}]
set extentDegrees $DEGperTIC
# set extentDegrees [expr {1.5 * $DEGperTIC}]
$canvas create arc $x1 $y1 $x2 $y2 \
-start -70 -extent $extentDegrees -style arc \
-outline red -fill red -width 8
## FOR TESTING: (exit this proc before adding more to the meter)
# return
##################################
## Draw 4 rivets around the meter.
##################################
set RIVETindentPx 10
set RIVEToutdentPx [expr {$curCanvasSizePx - $RIVETindentPx}]
## upper-left rivet
draw_rivet $canvas $RIVETindentPx $RIVETindentPx
## upper-right rivet
draw_rivet $canvas $RIVEToutdentPx $RIVETindentPx
## lower-left rivet
draw_rivet $canvas $RIVETindentPx $RIVEToutdentPx
## lower-right rivet
draw_rivet $canvas $RIVEToutdentPx $RIVEToutdentPx
####################################################################
## Draw a text-label near the bottom of the meter.
####################################################################
$canvas create text \
$centerXpx [expr {0.7 * $centerXpx}] \
-anchor center -justify center -fill black \
-text "%used" -font { Helvetica 10 normal roman}
}
## END OF proc 'make_one_tachometer'
##+########################################################################
## PROC 'draw_rivet'
##+########################################################################
## PURPOSE: Put a rivet at a specified center point.
## The center point is specified in pixels, as a location on
## the canvas of the GUI, relative to the upper left corner.
##
## (We pass the radius of the rivets in a global variable.)
##
## CALLED BY: the 'make_tachometer' proc
##+########################################################################
set rivetRadiusPx 4
proc draw_rivet { canvas centerXpx centerYpx } {
global rivetRadiusPx
## FOR TESTING:
# return
########################################################
## Draw a color shaded arc using
## - 5 arc segments around each half of the circle/oval
## - 3 pixels for width of the arc segments
## - -45 degrees for the start angle (darkest shade)
########################################################
draw_circle_shadow $canvas \
[expr {$centerXpx - $rivetRadiusPx}] \
[expr {$centerYpx - $rivetRadiusPx}] \
[expr {$centerXpx + $rivetRadiusPx}] \
[expr {$centerYpx + $rivetRadiusPx}] \
5 3 -45.0
}
## END OF proc 'draw_rivet'
##+########################################################################
## PROC 'draw_circle_shadow'
##+########################################################################
## PURPOSE: Puts a shadowed edge around an oval/circle in a specified 'box'.
##
## INPUTS: - the corner coordinates of the oval/circle box (in pixels)
## - number of segments for the arc (segments of differing color shade)
## - width (in pixels) to draw the arc segments
## - start angle for drawing the arc segments
##
## CALLED BY: the 'make_tachometers' and 'draw_rivets' procs
##+########################################################################
proc draw_circle_shadow {canvas x1 y1 x2 y2 Nsegs ARCwidthPx startDEGREES } {
## FOR TESTING: (dummy out this proc)
# return
set DEGperSHADE [expr {180.0/$Nsegs}]
for {set i 0} {$i <= $Nsegs} {incr i} {
set a [expr {($startDEGREES + $i * $DEGperSHADE)}]
set b [expr {($startDEGREES - $i * $DEGperSHADE)}]
## Make darker grays for greater angles.
set color255 [expr {40 + $i*(200/$Nsegs)}]
set hexcolor [format "#%x%x%x" $color255 $color255 $color255]
$canvas create arc \
$x1 $y1 $x2 $y2 \
-start $a -extent $DEGperSHADE \
-style arc -outline $hexcolor -width $ARCwidthPx
$canvas create arc \
$x1 $y1 $x2 $y2 \
-start $b -extent $DEGperSHADE \
-style arc -outline $hexcolor -width $ARCwidthPx
## FOR TESTING: (show each pair of segments before
## drawing the next pair)
# update
}
## END OF loop over the arc segments
}
## END OF proc 'draw_circle_shadow'
##+########################################################################
## PROC 'update_needles'
##+########################################################################
## PURPOSE: Updates needle(s) on square canvas(es) --- using the
## Linux '/proc/stat' file to get 'activity' data
## for the current user-selected CPU.
##
## This proc uses the 'update_one_needle' proc to update
## the needle for each of the Nmeters canvases.
##
## CALLED BY: the 'Additional GUI Initialization' section at the
## bottom of this script, and within this proc itself.
##+########################################################################
proc update_needles {} {
global argv0 DIRscripts WAITseconds VARsampcnt CPUname \
PREVuser PREVnice PREVsystem PREVidle
# global env
##########################################################
## Get user-nice-system-idle-etc data --- for$CPUname.
##########################################################
foreach {CPUcheck CURuser CURnice CURsystem CURidle} \
[exec $DIRscripts/get_cpu_usage_info.sh $CPUname] {break}
set PREVtot [expr {$PREVuser + $PREVnice + $PREVsystem + $PREVidle}]
set CURtot [expr {$CURuser + $CURnice + $CURsystem + $CURidle}]
incr VARsampcnt
## FOR TESTING:
if {0} {
puts "proc update_needles:"
puts "CPUname: $CPUname"
puts "PREVuser: $PREVuser CURuser: $CURuser"
puts "PREVnice: $PREVnice CURnice: $CURnice"
puts "PREVsystem: $PREVsystem CURsystem: $CURsystem "
puts "PREVidle: $PREVidle CURidle: $CURidle"
}
##############################################################
## Update the needle for $CPUname with %-user+nice+system data.
##############################################################
set denom [expr {$CURtot - $PREVtot}]
if {$denom <= 0} {
set PERCENTtot 0.0
set PERCENTuser 0.0
set PERCENTnice 0.0
set PERCENTsystem 0.0
set PERCENTidle 0.0
} else {
set numer8or [expr {($CURuser + $CURnice + $CURsystem) - \
($PREVuser + $PREVnice + $PREVsystem)}]
set PERCENTtot [expr {100.0 * $numer8or / $denom}]
set PERCENTuser [expr {100.0 * ($CURuser - $PREVuser) / $denom}]
set PERCENTnice [expr {100.0 * ($CURnice - $PREVnice) / $denom}]
set PERCENTsystem [expr {100.0 * ($CURsystem - $PREVsystem) / $denom}]
set PERCENTidle [expr {100.0 * ($CURidle - $PREVidle) / $denom}]
}
update_one_needle .fRmeters.fRmeter1 $CPUname $PERCENTtot \
$PERCENTuser $PERCENTnice $PERCENTsystem $PERCENTidle
############################################################
## Force the needles to show up on the GUI. (needed???)
############################################################
# update
################################################################
## 'Pseudo-Recursively' 'fork off' another (delayed) instance of the
## 'update_needles' here to support the wait-seconds scale widget
## --- using the 'after ms cmd arg arg ...' form of the 'after'
## command.
################################################################
set WAITmillisecs [expr {int($WAITseconds * 1000)}]
after $WAITmillisecs update_needles
################################################################
## Reset the PREV vars.
################################################################
set PREVuser $CURuser
set PREVnice $CURnice
set PREVsystem $CURsystem
set PREVidle $CURidle
}
## END OF proc 'update_needles'
##+########################################################################
## PROC 'update_one_needle'
##+########################################################################
## PURPOSE: Updates a needle on a square canvas --- using the
## canvas ID and the %-activity data passed as arguments.
##
## Input is the canvas ID. This proc queries the canvas to
## get its center and to determine an appropriate length for
## the needle as a proportion of the (square) canvas size.
##
## CALLED BY: the 'update_needles' proc
##+########################################################################
proc update_one_needle \
{frame CPUNAME PERCENT PERCENTuser PERCENTnice PERCENTsystem PERCENTidle} {
global pi radsPERdeg Nsegs MAXrate
## FOR TESTING: (dummy out this routine)
# return
#################################################
## Put data in 2 label lines above the meter.
#################################################
$frame.labelINFO1 configure -text \
"%user = [format "%6.2f" $PERCENTuser] %nice = [format "%6.2f" $PERCENTnice]"
$frame.labelINFO2 configure -text \
"%system = [format "%6.2f" $PERCENTsystem] %idle = [format "%6.2f" $PERCENTidle]"
############################################################
## Prepare to draw the needle on the meter.
## Set the angle for the zero-point on the arc-of-tic-marks.
############################################################
set angle0 250.0
## Convert RATE/MAXrate to an angle in radians on the arc.
if {$PERCENT > 100} {set PERCENT 100}
set degs [expr {$angle0 - (320.0 * $PERCENT / 100.0)}]
set rads [expr {$degs * $radsPERdeg}]
## FOR TESTING:
# puts "proc 'update_one_needle' :"
# puts "PERCENT: $PERCENT degs: $degs rads: $rads"
## Get the coord(s) of the center of the (square) canvas
## and calculate a length of the needle.
# set width [$frame.can cget -width]
set widthPx [winfo width $frame.can]
set halfPx [expr {int($widthPx / 2.0)}]
set lengthPx [expr {int($halfPx * 0.5)}]
####################################################################
## Before drawing the needle,
## draw a text-label, CPUNAME, near the bottom of the meter.
####################################################################
catch {$frame.can delete -tags TAG_cputext}
$frame.can create text \
$halfPx [expr {1.3 * $halfPx}] \
-anchor center -justify center -fill black \
-text "CPU: $CPUNAME" -font { Helvetica 10 normal roman} \
-tag TAG_cputext
################################################################
## Calculate the coordinates for the tip and base of the needle.
################################################################
set xtip [expr {$halfPx + $lengthPx*cos($rads)}]
set ytip [expr {$halfPx - $lengthPx*sin($rads)}]
# set xbase [expr {$halfPx + 0.2*$lengthPx*cos($rads)}]
# set ybase [expr {$halfPx - 0.2*$lengthPx*sin($rads)}]
set xbase $halfPx
set ybase $halfPx
## Remove a previous needle, if any.
catch {$frame.can delete -tags TAGneedle}
####################################################################
## Draw a red-line needle and a reddish-white line on either side
## --- for an (attempted) anti-aliasing effect.
##
## NOTE: This attempt at anti-aliasing did not work out well.
## This code needs improvement --- or simply one 'create line'.
####################################################################
$frame.can create line \
$xbase $ybase $xtip $ytip \
-fill #ff0000 -width 4 -tag TAGneedle
$frame.can create line \
[expr {$xbase + 1}] [expr {$ybase + 1}] \
[expr {$xtip + 1}] [expr {$ytip + 1}] \
-fill #ff8888 -width 2 -tag TAGneedle
$frame.can create line \
[expr {$xbase - 1}] [expr {$ybase - 1}] \
[expr {$xtip - 1}] [expr {$ytip - 1}] \
-fill #ff8888 -width 2 -tag TAGneedle
}
## END OF proc 'update_one_needle'
##+#############################################################
## proc Refresh
##
## PURPOSE: 'Refresh' the meter(s) and their needles ---
## for when the user wants a new 'reading' for
## the user-specified CPU
## and/or after the user resizes the window.
##
## CALLED BY: 'Refresh' button
##+#############################################################
proc Refresh {} {
global DIRscripts CPUname PREVuser PREVnice PREVsystem PREVidle
## Cancel pending needle update(s), before redrawing
## the meters and restarting the update-needles cycle.
set LISTids [after info]
foreach ID $LISTids {
after cancel $ID
}
foreach {CPUcheck PREVuser PREVnice PREVsystem PREVidle} \
[exec $DIRscripts/get_cpu_usage_info.sh $CPUname] {break}
## FOR TESTING:
if {0} {
puts "proc Refresh:"
puts "CPUname: $CPUname"
puts "PREVuser: $PREVuser"
puts "PREVnice: $PREVnice"
puts "PREVsystem: $PREVsystem"
puts "PREVidle: $PREVidle"
}
## Wait about 0.5 or 1.0 secs to get the next sample
## to update the needle(s) on the meter(s).
after 500
# after 1000
make_tachometers
update_needles
}
## END OF proc 'Refresh'
##+#############################################################
## proc show_cpus
##
## PURPOSE: Shows available CPU IDs --- in a
## popup message window.
##
## CALLED BY: 'ShowCPUs' button
##+#############################################################
proc show_cpus {} {
global DIRscripts
set CPUSlist [exec $DIRscripts/get_cpu_usage_info.sh cpuslist]
popup_msgVarWithScroll .topIFACES $CPUSlist
}
## END OF proc 'show_cpus'
##+#############################################################
## proc Report
##
## PURPOSE: Shows a report on CPU data for ALL the CPUs,
## in a popup message window.
##
## CALLED BY: 'Report' button
##+#############################################################
proc Report {} {
global DIRscripts
############################################################
## Get the report from an external shell script, into a
## Tcl variable. Then show the report in a popup window.
##
## The shell script gets data for ALL the CPUs, then,
## after about 0.5 or 1 second, it gets the data for
## ALL the CPUs, again. The script combines and sorts
## the two lists of data for the CPU-IDs and feeds the
## sorted list into an 'awk' program to build the report.
###########################################################
set REPORTtext [exec $DIRscripts/get_cpu_usage_info.sh all]
popup_msgVarWithScroll .topREPORT "$REPORTtext"
}
## END OF proc 'Report'
##+#############################################################
## proc ReDraw_if_canvases_resized
##
## PURPOSE: To handle resizing the meter(s) when the window is
## resized --- IF the <Configure> binding is implemented.
##
## The intent is to avoid too many redraws --- for
## almost every little resize of the window as its
## border(s) are dragged.
##
## CALLED BY: bind .fRmeters.can <Configure>
## at bottom of this script.
##+#############################################################
## NOT IMPLEMENTED.
## Code is included for possible future development.
##+#############################################################
proc ReDraw_if_canvases_resized {} {
global PREVcanvasesWidthPx PREVcanvasesHeightPx draw_wait0or1
## FOR TESTING: (to dummy out this proc)
# return
if {$draw_wait0or1 == 1} {return}
## Set the wait indicator and delay doing the canvas resize
## check for about 300 milliseconds --- to allow time for the
## user to stop moving the window. After about 300 milliseconds,
## it is unlikely that the window is moving and thus causing
## multiple redraws.
set draw_wait0or1 1
after 900
set CURcanvasesWidthPx [winfo width .fRmeters]
set CURcanvasesHeightPx [winfo height .fRmeters]
if { $CURcanvasesWidthPx != $PREVcanvasesWidthPx || \
$CURcanvasesHeightPx != $PREVcanvasesHeightPx} {
## The 'after' could be used to prevent too many
## redraws (and flickering and unnecessary processing)
## as the window is being moved.
# after 200
make_tachometers
update_needles
set PREVcanvasesWidthPx $CURcanvasesWidthPx
set PREVcanvasesHeightPx $CURcanvasesHeightPx
set draw_wait0or1 0
}
}
## END OF proc 'ReDraw_if_canvases_resized'
##+########################################################################
## PROC 'popup_msgVarWithScroll'
##+########################################################################
## PURPOSE: Report help or error conditions to the user.
##
## We do not use focus,grab,tkwait in this proc,
## because we use it to show help when the GUI is idle,
## and we may want the user to be able to keep the Help
## window open while doing some other things with the GUI
## such as putting a filename in the filename entry field
## or clicking on a radiobutton.
##
## For a similar proc with focus-grab-tkwait added,
## see the proc 'popup_msgVarWithScroll_wait' in a
## 3DterrainGeneratorExaminer Tk script.
##
## REFERENCE: page 602 of 'Practical Programming in Tcl and Tk',
## 4th edition, by Welch, Jones, Hobbs.
##
## ARGUMENTS: A toplevel frame name (such as .fRhelp or .fRerrmsg)
## and a variable holding text (many lines, if needed).
##
## CALLED BY: 'help' button
##+########################################################################
## To have more control over the formatting of the message (esp.
## words per line), we use this 'toplevel-text' method,
## rather than the 'tk_dialog' method -- like on page 574 of the book
## by Hattie Schroeder & Mike Doyel,'Interactive Web Applications
## with Tcl/Tk', Appendix A "ED, the Tcl Code Editor".
##+########################################################################
proc popup_msgVarWithScroll { toplevName VARtext } {
## global fontTEMP_varwidth #; Not needed. 'wish' makes this global.
## global env
# bell
# bell
#################################################
## Set VARwidth & VARheight from $VARtext.
#################################################
## To get VARheight,
## split at '\n' (newlines) and count 'lines'.
#################################################
set VARlist [ split $VARtext "\n" ]
## For testing:
# puts "VARlist: $VARlist"
set VARheight [ llength $VARlist ]
## For testing:
# puts "VARheight: $VARheight"
#################################################
## To get VARwidth,
## loop through the 'lines' getting length
## of each; save max.
#################################################
set VARwidth 0
#############################################
## LOOK AT EACH LINE IN THE LIST.
#############################################
foreach line $VARlist {
#############################################
## Get the length of the line.
#############################################
set LINEwidth [ string length $line ]
if { $LINEwidth > $VARwidth } {
set VARwidth $LINEwidth
}
}
## END OF foreach line $VARlist
## For testing:
# puts "VARwidth: $VARwidth"
###############################################################
## NOTE: VARwidth works for a fixed-width font used for the
## text widget ... BUT the programmer may need to be
## careful that the contents of VARtext are all
## countable characters by the 'string length' command.
###############################################################
#####################################
## SETUP 'TOP LEVEL' HELP WINDOW.
#####################################
catch {destroy $toplevName}
toplevel $toplevName
# wm geometry $toplevName 600x400+100+50
wm geometry $toplevName +100+50
wm title $toplevName "Note"
# wm title $toplevName "Note to $env(USER)"
wm iconname $toplevName "Note"
#####################################
## In the frame '$toplevName' -
## DEFINE THE TEXT WIDGET and
## its two scrollbars --- and
## DEFINE an OK BUTTON widget.
#####################################
if {$VARheight > 10} {
text $toplevName.text \
-wrap none \
-font fontTEMP_fixedwidth \
-width $VARwidth \
-height $VARheight \
-bg "#f0f0f0" \
-relief raised \
-bd 2 \
-yscrollcommand "$toplevName.scrolly set" \
-xscrollcommand "$toplevName.scrollx set"
scrollbar $toplevName.scrolly \
-orient vertical \
-command "$toplevName.text yview"
scrollbar $toplevName.scrollx \
-orient horizontal \
-command "$toplevName.text xview"
} else {
text $toplevName.text \
-wrap none \
-font fontTEMP_fixedwidth \
-width $VARwidth \
-height $VARheight \
-bg "#f0f0f0" \
-relief raised \
-bd 2
}
button $toplevName.butt \
-text "OK" \
-font fontTEMP_varwidth \
-command "destroy $toplevName"
###############################################
## PACK *ALL* the widgets in frame '$toplevName'.
###############################################
## Pack the bottom button BEFORE the
## bottom x-scrollbar widget,
pack $toplevName.butt \
-side bottom \
-anchor center \
-fill none \
-expand 0
if {$VARheight > 10} {
## Pack the scrollbars BEFORE the text widget,
## so that the text does not monopolize the space.
pack $toplevName.scrolly \
-side right \
-anchor center \
-fill y \
-expand 0
## DO NOT USE '-expand 1' HERE on the Y-scrollbar.
## THAT ALLOWS Y-SCROLLBAR TO EXPAND AND PUTS
## BLANK SPACE BETWEEN Y-SCROLLBAR & THE TEXT AREA.
pack $toplevName.scrollx \
-side bottom \
-anchor center \
-fill x \
-expand 0
## DO NOT USE '-expand 1' HERE on the X-scrollbar.
## THAT KEEPS THE TEXT AREA FROM EXPANDING.
pack $toplevName.text \
-side top \
-anchor center \
-fill both \
-expand 1
} else {
pack $toplevName.text \
-side top \
-anchor center \
-fill both \
-expand 1
}
#####################################
## LOAD MSG INTO TEXT WIDGET.
#####################################
## $toplevName.text delete 1.0 end
$toplevName.text insert end $VARtext
$toplevName.text configure -state disabled
}
## END OF PROC 'popup_msgVarWithScroll'
##+########################
## END of PROC definitions.
##+########################
## Set HELPtext var.
##+########################
set HELPtext "\
\ \ ** HELP for this 'CPU Activity' Monitoring Utility **
This utility is meant to show a GUI that holds a tachometer-style
METER, with a range of 0 to 100 percent.
The needle on the meter shows the PERCENT of usage of a CPU
--- for a user-specifiable CPU name/IDentifier, where the
computer running this utility may have multiple CPU's.
Initially, the 'CPU name' is set to 'cpu' which represents
the total (or average) activity of ALL the CPU's for a computer
with multiple CPU's. If the computer has a single CPU, then
the CPU name 'cpu' refers to that single CPU.
The 'ShowCPUs' button can be used to show all the CPU ID's
available on the computer. Example ID's for a 2-CPU computer:
'cpu', 'cpu0', and 'cpu1'.
For example, if 'cpu0' is a valid CPU ID, that CPU name
can be entered in the 'MonitorCPU' entry field to reset
the CPU for which the meter displays the PERCENT-USAGE.
The needle on the meter is updated periodically ---
according to a 'SampleRate' (seconds) setting on the GUI.
The seconds-setting can be reset by a 'scale' widget.
Alternatively, instead of depending on auto-updates,
the user may choose to click on a 'Refresh' button ---
to immediately update the meter with a new
PERCENT-USAGE value for the user-selected CPU.
Then auto-updates continue according to
the current 'SampleRate' setting.
Besides PERCENT-USAGE, the actual '%-user' and '%-system'
values may be shown for the user-selected CPU.
The user can click on a 'Report' button on the GUI to show
the activity values, in detail, for ALL the CPU's
of the computer. The report is shown in a popup text window.
The user can copy-and-paste the text into another window,
such as a text editor or word processor window.
This Tcl-Tk script was developed on Linux and uses the
'/proc/stat' file to get the CPU acitivity data --- for
the meter and for the 'Report' option and the
'ShowCPUs' option.
***************************************
WINDOW RESIZE (an experimental feature):
The user may resize the window rather than using a fixed window
(and fixed meter) size. If the user resizes the window, the
'Refresh' button can be used to force the meter to be resized
according to the new window size. (The meter may be resized
such that it is 'too big' for the new window size. Just pull
an edge or corner of the window, to see the entire meter.)
************************************
THE SCRIPT USED to update the meters:
A Tcl 'exec' command calls on a separate shell script ---
'get_cpu_usage_info.sh' --- that uses the file '/proc/stat'
(or an equivalent file/command) to get CPU usage data --- and
extract-and-format the data for return to this Tk script.
This shell script is used for 3 functions of this GUI:
1) To show CPU-activity-level via the meter, for a
user-specified CPU.
2) To show the CPU ID names known to this computer.
3) To present a CPU activity report for all the CPU's
known to this computer.
If the '/proc/stat' file is not available on your computer,
you may have to edit the shell script to use a different
command/technique to get the CPU data.
For a computer operating system other than a Linux, Unix,
BSD, or Apple-Mac system, you may need to write a C program to
get appropriate CPU activity data.
***********************
CAPTURING THE GUI IMAGE:
A screen/window capture utility (like 'gnome-screenshot'
on Linux) can be used to capture the GUI image in a PNG
or GIF file, say.
If necessary, an image editor (like 'mtpaint' on Linux)
can be used to crop the window capture image. The image
could also be down-sized --- say to make a smaller image
suitable for use in a web page or an email.
"
##+################################################################
##+################################################################
## Additional GUI INITIALIZATION: Mainly to
## - Put the meter(s) on their canvas(es), with 'make_tachometers'.
## - Start an execution loop for the 'update_needles' proc.
##+################################################################
##+########################################################
## Set a default CPU-ID for the entry widget.
##+########################################################
set CPUname "cpu"
##+###################################################
## Set the scale widget var for initial 'refresh rate'
## (actually wait-time = 'wave-length', not 'frequency')
## --- in seconds.
##
## We set this before the following 'update' command,
## so that the slider-button on the scale widget is
## positioned accordingly when the GUI first appears.
##+###################################################
# set WAITseconds 10.0
# set WAITseconds 5.0
set WAITseconds 2.0
# set WAITseconds 1.0
##+#####################################################
## Set a max-value to use for the limit on the meter.
##+#####################################################
set MAXvalue 100
##+####################################################
## Set a number of segments and labels for the meter,
## according to the MAXvalue setting.
##+####################################################
set Nsegs 10
set ticLabels "0 10 20 30 40 50 60 70 80 90 100"
##+#################################################
## Draw the tachometer(s) (without needle).
##+#################################################
## Need 'update' here to set the size of the canvases,
## because 'make_tachometers' uses 'winfo' to get
## the width and height of some frames and canvases.
##+#################################################
update
make_tachometers
##+#############################################################
## Get the directory that this Tk script is in. That will be the
## directory that the 'external' utility shell script should be
## in. This directory is used to call the shell script that
## is used in the 'update_needles', 'show_cpus', and 'Report'
## procs.
##+#############################################################
## FOR TESTING:
# puts "argv0: $argv0"
# set DIRscripts "."
# set DIRscripts "[pwd]"
# set DIRscripts "$env(HOME)/apps/tkUtils"
set DIRscripts "[file dirname $argv0]"
##+#########################################################
## Get an initial sample of the 'jiffies' data for $CPUname.
##+#########################################################
foreach {CPUcheck PREVuser PREVnice PREVsystem PREVidle} \
[exec $DIRscripts/get_cpu_usage_info.sh $CPUname] {break}
## FOR TESTING:
# puts "PREVuser: $PREVuser PREVnice: $PREVnice"
# puts "PREVsystem: $PREVsystem PREVidle: $PREVidle"
##+####################################################
## Initialize the variable we use to keep track of
## the sample count.
##+####################################################
set VARsampcnt 0
##+######################################################
## Do an initial draw of the needles, after WAITseconds.
##
## NOTE:
## 'update_needles' starts a loop to keep updating the needles.
##
## The proc 'update_needles' calls itself ---
## with 'after <millisecs>'.
##
## NOTE1:
## The 'after' call is a
## 'recursive-like-call-with-FORKED-AND-DELAYED-execution'.
## The proc immediately returns to processing after doing the
## 'queue-command-with-delay'.
##
## NOTE2:
## This GUI provides the user with the 'Refresh'
## button to force a needle update --- for example,
## if the user resizes the window and wants to force
## a refresh (which runs 'make_tachometers') to resize
## the meters and get the data that the 'update_needles'
## proc uses to draw the needles on the meters.
##+######################################################
set WAITmillisecs [expr {int(1000*$WAITseconds)}]
after $WAITmillisecs update_needles
##+#################################################
## Set a resize binding on the canvas ---
## to redraw the tachometers and needles
## if the window is resized.
##
## DE-ACTIVATED, for now.
## (Code is here for future experimentation.
## It is not easy to avoid extraneous redraws of
## the GUI as the window is being dragged/resized.)
##+#################################################
if {0} {
set draw_wait0or1 0
set PREVcanvasesWidthPx [winfo width .fRmeters]
set PREVcanvasesHeightPx [winfo height .fRmeters]
bind .fRmeters <Configure> "ReDraw_if_canvases_resized"
}
The shell script (the 'wrapee') :
And here is the code for the shell script called by this Tk script. This is a wrapper script for the 'cat /proc /stat' command. This script takes a single string-parameter which can be either 'all' or 'cpuslist' or a CPU-ID ('cpu', 'cpu0', 'cpu1', ...).
You can put this script in the same directory with the Tk script. The Tk script includes some code (involving the 'argv0' variable) to determine the location of the shell script by extracting the name of the directory in which the Tk script lies.
#!/bin/sh
##
## SCRIPT NAME: get_cpu_usage_info.sh
##
## PURPOSE:
##  This script gets 'user', 'nice', 'system', and 'idle' CPU-data
##  (in 'jiffies' --- typically hundredths of a second)) via output
##  from the command 'cat /proc/stat'.
##
##  This shell script is meant to be capable of returning info of 3 types:
##    1) a report of the usage of ALL the CPU's known to '/proc/stat'
##    2) a list of the CPU's --- for example, cpu, cpu0, cpu1, ...
##    3) 'user', 'nice', 'system', and 'idle' data for a user-specified CPU.
##
## This script takes a single parameter --- a text string --- to indicate
## which of these 3 types of info to return:
##     1) 'all'
##     2) 'cpuslist'
##     3) the name of a cpu, such as 'cpu0' or 'cpu1' --- or simply 'cpu'
##        which represents all the CPU's.
##
## Example output from the 'cat /proc/stat' command:
##
## cpu  39842 1406 12184 1523220 6634 95 1824 0 0
## cpu0 18990 914 4855 758670 3358 40 54 0 0
## cpu1 20852 492 7329 764549 3275 54 1770 0 0
## intr 872783 276605 3275 0 0 0 0 0 0 1 25293 0 0 ... about 300 more integers
## ctxt 1582873
## btime 1385094848
## processes 2593
## procs_running 2
## procs_blocked 0
## softirq 567280 0 343218 2282 831 26582 7400 120750 119 66098
##
#########################################
## EXPLANATION OF 'cat /proc/stat' OUTPUT:
##
## According to http://www.linuxhowtos.org/System/procstat.htm,
## the lines above can be described as follows.
##
## The very first "cpu" line aggregates the numbers in all of
## the other "cpuN" lines.
##
## These numbers identify the amount of time the CPU has spent
## performing different kinds of work. Time units are in USER_HZ
## or Jiffies (typically hundredths of a second).
##
## (The jiffie numbers reported in file /proc/stat are aggregates
##  since the system first booted. Hence to get the values over
##  a time interval, one should get the difference of values
##  at a pair of start and end times.)
##
## The meanings of the columns are explained in 'man proc' ---
## specifically, the section on '/proc/stat'. The integers in the
## columns are 'jiffies' for columns, from left to right:
##
##   1 * user: normal processes executing in user mode
##   2 * nice: niced processes executing in user mode
##   3 * system: processes executing in kernel mode
##   4 * idle: twiddling thumbs
## After Linux 2.6.x kernels:
##   5 * iowait: waiting for I/O to complete
##   6 * irq: servicing interrupts
##   7 * softirq: servicing softirqs
##   8 * steal_time: the ticks spent in other operating systems when
##       running in a virtualized environment like Xen - since the
##       2.6.11 Linux kernel
##   9 * guest: for time spent running a virtual CPU for guest operating
##       systems under the control of the Linux kernel - since the
##       2.6.24 Linux kernel
##
## The "intr" line gives counts of interrupts serviced since boot time,
## for each of the possible system interrupts. The first column is
## the total of all interrupts serviced; each subsequent column is
## the total for that particular interrupt.
##
## The "ctxt" line gives the total number of context switches
## across all CPUs.
##
## The "btime" line gives the time at which the system booted,
## in seconds since the Unix epoch.
##
## The "processes" line gives the number of processes and threads
## created, which includes (but is not limited to) those created by
## calls to the fork() and clone() system calls.
##
## The "procs_running" line gives the number of processes currently
## running on CPUs.
##
## The "procs_blocked" line gives the number of processes currently
## blocked, waiting for I/O to complete.
##
##########################################
## THE 3 FUNCTIONS OF THIS SCRIPT:
##
## 1)
## If 'all' is passed, all the cpu-lines data from the 'cat /proc/stat'
## command is used. It is reformatted from 'jiffies' into percents in
## 'user', 'nice', 'system', and 'idle' columns.
## The reformatted columnar data is returned by this script ---
## to stdout (standard-out).
##
## 2)
## If 'cpuslist' is passed, a list of the CPU's is passed. Here is an
## how the list is created, using 'grep' and 'awk':
##
## $ cat /proc/stat | grep '^cpu' | awk '{print $1}'
## cpu
## cpu0
## cpu1
##
##
## The list is returned to stdout.
##
## 3)
## If a cpu-name is passed (like 'cpu0' or 'cpu1' or 'cpu'),
## the user-nice-system-idle-etc 'jiffies' data is returned. Example:
## A line like
##
## cpu0 18990 914 4855 758670 3358 40 54 0 0
##
## may be returned to stdout.
##
##+#########
## CALLED BY: a Tk GUI script that shows CPU usage data as PERCENT-used
##            needle readings on one or more meters (dials) drawn on a
##            Tk canvas --- Tk script name:
##                    meters_cpu_usage.tk
##
## The 'all' output is intended to be used to show usage for ALL the CPU's
## in a text-window of the Tk script GUI.
##
## The 'cpuslist' output is intended to be used to show a list of ALL the
## CPU names.
##
##+###################
## MAINTENANCE HISTORY:
## Updated by: Blaise Montandon 2013nov21 Started this script on Linux,
##                                        using Ubuntu 9.10 (2009 October,
##                                        'Karmic Koala').
## Updated by: Blaise Montandon 2013dec04 Prep the 'awk' program for the
##                                        'all' input parameter.
##+#########################################################################

## FOR TESTING: (show statements as they execute)
#  set -x

## Simply exit if there is no argument passed to this script.

if test "$1" = ""
then
   exit
fi

##+#############################################################
## THE FOLLOWING IS EXECUTED IF $1 CONTAINS 'cpuslist'.
##
## The output goes to standard-out.
##
##+############################################################

if test "$1" = "cpuslist"
then
   cat /proc/stat | grep '^cpu' | awk '{print $1}'
   exit
fi
## END OF if test "$1" = "cpuslist" SECTION.


if test "$1" = "all"
then

   ##########################################################################
   ## SET REPORT HEADING.
   ##########################################################################

   HOST_ID="`hostname`"

   echo "\
......................... `date '+%Y %b %d  %a  %T%p %Z'` ........................

CPU USAGE for CPU(s) ON HOST *** $HOST_ID ***


      If there is more than one CPU, the data for individual CPU's
      is labelled 'cpu0', 'cpu1', ...

      The totals (summed data) for ALL the CPU's is labelled 'cpu'.


      CPU USAGE is presented in clock 'ticks' --- sometimes called 'jiffies'
      which are on the order of 1/100th of a second.

                                             5           6
  0        1      2      3         4     Activity      Total      *PERCENT*
 CPU      User   Nice  System     Idle      Total      ticks      CPU-usage
  ID     ticks  ticks   ticks    ticks    (1+2+3)  (1+2+3+4)  (100 * 5 / 6)
------  ------  ----- -------  -------  ---------  ---------  -------------
"


   ##########################################################################
   ## Get the CPU data lines from file '/proc/stat' --- all lines that start
   ## with 'cpu'. Get the data twice, separated by about 0.5 or 1 second.
   ##########################################################################

   CPUdata1="`cat /proc/stat | grep '^cpu'`"
   SECONDS=3
   # SECONDS=1
   sleep $SECONDS
   CPUdata2="`cat /proc/stat | grep '^cpu'`"


   ##########################################################################
   ## Concatenate the two sets of data together and pipe the data into
   ## 'sort', and then into an 'awk' program to get the difference
   ## data --- the difference of user-nice-system-idle-etc 'jiffies'
   ## for each CPU --- and format the report lines.
   ##########################################################################
   ## SAMPLE CALCULATION:
   ##
   ## If the information for a cpu is displayed like this:
   ##
   ## cpu 607557 143290 385125 136873807 1279793 18764 14856 0 0
   ##
   ## To get the average system load over any given amount of time,
   ## from the FIRST data sample,
   ## we read only the first four values into variables (for example,
   ## let us call them u1, n1, s1, and i1).
   ##
   ## Then we read the values from the SECOND data sample into
   ## new variables, u2, n2, s2, and i2.
   ##
   ## The total usage time is equal to
   ##
   ##     (u2-u1) + (n2 - n1) + (s2 - s1).
   ##
   ## The total time overall is the usage time + (i2-i1).
   ##
   ## Take (100*usage)/total to get the percent-CPU-usage.
   ##
   ## If there are multiple CPU's, also get the percent-CPU-usage for
   ## 'cpu0', 'cpu1', ...
   ##
   ## -----------------------------
   ## Similar /proc/stat info is at:
   ## http://juliano.info/en/Blog:Memory_Leak/Understanding_the_Linux_load_average
   ## http://www.linuxhowtos.org/System/procstat.htm
   ## http://stackoverflow.com/questions/5514119/accurately-calculating-cpu-utilization-in-linux-using-proc-stat
   ## http://askubuntu.com/questions/120953/exact-field-meaning-of-proc-stat
   ## http://man7.org/linux/man-pages/man5/proc.5.html
   ## http://stackoverflow.com/questions/1420426/calculating-cpu-usage-of-a-process-in-linux
   ############################################################################

   CPUdata="$CPUdata1
$CPUdata2"

   echo "$CPUdata" | sort | awk '{
cpuid1=$1
u1=$2
n1=$3
s1=$4
i1=$5
getline
cpuid2=$1
u2=$2
n2=$3
s2=$4
i2=$5

du=u2 - u1
dn=n2 - n1
ds=s2 - s1
di=i2 - i1

act=du + dn + ds
tot=act + di
pcent=100 * act / tot

printf("%-6s %7d %6d %7d %8d %10d %10d %11.2f\n",cpuid2,du,dn,ds,di,act,tot,pcent)

}'
## END of awk  program

   ##########################################################################
   ## ADD REPORT 'TRAILER'.
   ##########################################################################

   SCRIPT_BASENAME=`basename $0`
   SCRIPT_DIRNAME=`dirname $0`

   echo "
......................... `date '+%Y %b %d  %a  %T%p %Z'` ........................

   The output above is from script

$SCRIPT_BASENAME

   in directory

$SCRIPT_DIRNAME


   This script ran the command 'cat /proc/stat' twice ($SECONDS SECONDS APART)
   and used the 'user', 'nice', 'system', and 'idle' data for each CPU
   on host  $HOST_ID to formulate the report.

   The script concatenates the lines of CPU data from the two
   data-samples, sorts the lines by CPU using the 'sort' command,
   and pipes the sorted data (2 lines for each CPU) into an
   'awk' program.

   For the 2 lines of data for each CPU,
   the 'awk' program gets the difference of the 'user', 'nice',
   'system', and 'idle' data and calculates the PERCENT-CPU-USAGE
   as indicated in the column headings above.

......................... `date '+%Y %b %d  %a  %T%p %Z'` ........................
"
   exit

fi
## END OF if test "$1" = "all" SECTION.


##+#############################################################
## THE FOLLOWING IS EXECUTED IF $1 CONTAINS ANYTHING other than,
## 'all' or 'cpuslist'. It is assumed that $1 contains a CPU
## name such as 'cpu0' or 'cpu1' or 'cpu'.
##
## The output goes to standard-out.
##
## EXAMPLE OUTPUT FROM THE 'PIPE' BELOW, for 'cpu0':
##
## cpu0 18990 914 4855 758670 3358 40 54 0 0
##
##+#############################################################

cat /proc/stat | grep "$1" | head -1
NINE NUMBERS (NOT FOUR)
In the sample output from 'cat /proc/stat' shown at the top of this page, the several 'cpu' lines looked like
   cpu  39842 1406 12184 1523220 6634 95 1824 0 0
   cpu0 18990 914 4855 758670 3358 40 54 0 0
   cpu1 20852 492 7329 764549 3275 54 1770 0 0
Note that there are 9 numbers in each line, not just four (user, nice, system, idle).
The command 'man proc', in the section on '/proc/stat', explains that the 9 numbers are
   1 - user: normal processes executing in user mode
   2 - nice: niced processes executing in user mode
   3 - system: processes executing in kernel mode
   4 - idle: twiddling thumbs

   After Linux 2.6.x kernels:

   5 - iowait: waiting for I/O to complete
   6 - irq: servicing interrupts
   7 - softirq: servicing softirqs
   8 - steal_time: the ticks spent in other operating systems when
       running in a virtualized environment like Xen - since the
       2.6.11 Linux kernel
   9 - guest: for time spent running a virtual CPU for guest operating
       systems under the control of the Linux kernel - since the
       2.6.24 Linux kernel
When I was doing web searches on how to use this data to calculate a 'percent-activity' figure for a CPU, almost everyone described using only the first 4 numbers.
In the sample 3 'cpu' lines above (taken from my little Acer netbook computer), you can see that the last 2 columns (corresponding to 'virtualization') are zeros. In fact, even on my main desktop computer, I never have a need for running 'virtual machines' on my computer. So I will probably never have a need to take columns 8 and 9 into account.
HOWEVER, people who are doing 'virtualization' on their machines may find that they want to take the data in columns 8 and 9 into account.
FURTHERMORE, in the sample from my netbook, the data from columns 5,6,7 (iowait, irq, softirq) are quite often larger than the data in the 'nice' column. So perhaps those columns should be employed in the calculation of 'percent-activity' of a CPU.
Taking the descriptions of the 9 columns above at 'face value', it looks like 'iowait' is wasted cycles, and it MAY be that 'iowait' and 'idle' should be added together to get an 'inactivity' number.
And it looks like one could get a 'modern' value for 'percent-activity' of a CPU by adding all 9 numbers together to get a denominator for the calculation. Then subtract 'idle' and 'iowait' from that total to get the numerator for the 'percent-activity' calculation.
In any case, if you want to use more than just the first 4 columns, there are two places that code should be changed:
  1) For the report from the 'Report' button, change the
     'awk' program in the shell script.

  2) To change the calculations for a given CPU, change
     the 'update_needles' proc in the Tk script.
Even if people raise various technical objections to using the data from /proc/stat, it appears that using the 4 or 9 columns from the 'cpu' lines of file /proc/stat should give 'good enough' estimates of the 'percent-activity' of each CPU.
MORE METER UTILITIES:
This completes my 'to-do' list ---at the bottom of my 'bio' page at uniquename --- in the 'CME' (Code for MEters) group.
HOWEVER, I may return to at least one of the 4 meter utilities for which I used 'tachometer-style' meters based on the code of Marco Maggi --- which used 'create line', 'create arc', and 'create text' Tk canvas commands to create the meters.
A 'create image' technique:
Instead, I may try using a 'create image' technique --- along with realistic images of meter backgrounds --- to make HD (high-definition) meters --- thus avoiding the jaggies in the arcs and tic-marks.
Furthermore, I may try an image technique to make a high-quality needle that does not suffer from 'the jaggies'.
One advantage of building the meter with 'create line,arc,text' is that the meter can be resized to ANY size using some simple arithmetic. If I implement a meter with a 'create image' technique, I may provide small/medium/large images from which the user can choose. This would allow some choice of size, and yet not incur an odious amount of processing (and/or wait-time for re-display) by trying to re-size an image via CPU-intensive image processing, to scale a single given image.
(This assumes that it is more efficient to load an image file into memory than to sweep through an in-memory image, averaging-or-whatever the neighboring pixels, to create a new-sized image. There is also the problem of creating a good-quality image by scaling a single image up or down --- which argues for using the small/medium/large technique.)
---
A 'moving skyscraper silhouette' technique:
Another type of display that I may try on the Tk canvas is a 'moving mountain-range silhouette' --- which one sees in some 'system monitor' apps, such as 'gnome-system-monitor' (on Linux) --- under the 'Resources' tab, titled 'CPU history'.
This kind of display has the advantage of preserving the recent history of the CPU percentage of one or more CPU's --- about 6 minutes of history across a 180-pixel-wide canvas, if we are sampling about once every 2 seconds.
This type of animated plot could be created with Tk by using a 'create line' technique on the Tk canvas, to plot vertical lines (to create a 'silhouette-type' plot) --- or simply single pixels (to create a 'thin-line-type' plot).
This 'history display' technique may be especially suitable for an alternative version of 3 of the 4 apps that I have implemented: the 'memory-and-swap', the 'network activity', and the 'CPU activity' apps. Those are the 3 types of activity shown in the 'Resources' panel of the 'gnome-system-monitor' utility.
They under-estimate you ... Tcl, Tk, and wish
By the way, these 4 Tk Maggi-meter apps using Tcl-Tk *scripting* are much less CPU-consumptive than the *compiled code* 'gnome-system-monitor' program --- thus demonstrating that 'compiled code' is not always faster and more efficient than 'script code'.
When I run 'gnome-system-monitor' and these Tk scripts at the same time, and when I look at the processes running sorted by CPU% (in the gnome-system-monitor 'Processes' panel display), 'gnome-system-monitor' is shown as constantly 'Running' (at 4% CPU, or much more), while the Tk scripts are almost constantly 'Sleeping' (at 0% CPU).
(Thank you, wonderful 'wish' interpreter --- and Gnu/Linux scripting.)
---
Oh, the possibilities we have with Tk. The possibilities are endless ... I say to the 'Tcl is dead' nay-sayers ... those 'nattering nabobs of negativism' [L3 ].
IN CONCLUSION
As I have said on several other code-donation pages on this wiki ...
There's a lot to like about a utility that is 'free freedom' --- that is, no-cost and open-source so that you can modify/enhance/fix it without having to wait for someone else to do it for you (which may be never).
A BIG THANK YOU to Ousterhout for starting Tcl-Tk, and a BIG THANK YOU to the Tcl-Tk developers and maintainers who have kept the simply MAH-velous 'wish' interpreter going.