Electronic Failure Rate FITS and eTCL Slot Calculator Demo Example
Electronic Failure Rate FITS and eTCL Slot Calculator Demo Example
This page is under development. Comments are welcome, but please load any comments in the comments section at the bottom of the page. Please include your wiki MONIKER and date in your comment with the same courtesy that I will give you. Aside from your courtesy, your wiki MONIKER and date as a signature and minimal good faith of any internet post are the rules of this TCL-WIKI. Its very hard to reply reasonably without some background of the correspondent on his WIKI bio page. Thanks,gold
- Electronic Failure Rate FITS and eTCL Slot Calculator Demo Example
- Introduction
- Pseudocode and Equations
- Testcases Section
- Screenshots Section
- figure 1.
- figure. FIT DEFINITION AND UNIT CONVERSIONS
- figure. TEST TRIAL PROTOCOL: 1000-HOUR REPLACEMENT RULE
- figure. TESTCASE RESULTS SUMMARY
- figure. MTBF AND MTTF: DEFINITIONS AND EXAMPLES
- figure. CALCULATE PROC: FORMULA FLOW
- figure. eTCL SLOT CALCULATOR: GUI LAYOUT
- figure. FILLUP AND CLEARX PROCS
- figure. REPORTX PROC: CONSOLE OUTPUT FORMAT
- figure. FAILURE RATE UNIT SCALE LADDER
- figure. LED LIGHTBULB CONTEXT AND ASSUMPTIONS
- figure. PSEUDOCODE AND PRICE EQUATIONS (from page)
- figure. OVERALL PROGRAM FLOW
- References:
- Appendix Code
- Comments Section
Introduction
gold Here is some eTCL starter code for calculating the failure rate of electronic devices in failures per billion device-hours or Failures In Time (FIT). This report will use less strict definitions and not consider confidence levels for FIT, since the main interest is developing a simple and quick calculator. The impetus for these calculations was reported failure rates in some light emitting diode (LED) lightbulbs. Most of the testcases involve replicas or models, using assumptions and rules of thumb.
In planning any software, it is advisable to gather a number of testcases to check the results of the program. The results of the testcases were estimated using the hand calculator and then checked in the eTCL calculator. Additional significant figures are used to check the eTCL calculator, not to infer the accuracy of inputs and product reports. For the 3 testcases, there were sets of trials lasting up to 1000 hours. If the device lasted 1000 hours, a new device was switched in. The first testcase was 592, 642, 595, 1000, and 1000 hours. The hand calculator returned an average failure rate of 3 failures /(592+ 642+595+ 1000+ 1000) hours, 3/3829, or 0.0007834 failures per hour. Converting, the failure rate was 0.0007834*1E6, 783.4 failures per million hours and 0.0007834*1E9, 0.783 failures per billion hours (FIT) . The eTCL calculator returned 0.7349 FITS. The second testcase was 592, 642, 595, 1000, and 1000 hours. In the hand calculator, the average failure rate was 3/(592+ 642+595+ 1000+ 1000),3/3737, 0.0008027 failures per hour. The conversion by 1E6 and 1E9 was 802.7 f/1E6 hours and 0.8027 FITS, respectively. On the second testcase, the eTCL calculator returned 0.802 FITS. The third testcase was 3/(644+ 604+650+ 1000+1000) or 0.0007696 failures per hour. The conversion by 1E9 was 0.77 FITS in the hand calculator. The eTCL calculator returned 0.769 FITS for the third testcase.
The mean time between failures, abbreviated as MTBF, equals 10E9*(1/FIT). The analysis made some trial estimates for MTBF. For the first testcase, the trial MTBF is 10E9*(1/FIT), 10E9*(1/0.783), or 12.77E9 hours. For the second testcase, the trial MTBF is 10E9*(1/FIT), 10E9*(1/0.8027), or 12.45E9 hours. For the third testcase, the trial MTBF is 10E9*(1/FIT), 10E9*(1/0.769), or 13.00E9 hours.
For comparison, the MTBF in the testcases was compared with the understanding of the mean time to failure, MTTF. The MTBF in the first testcase was 5*1000/3, 1666 hours per failure. The MTTF was 5*1000/5, 1000 hours per failure. For a disk drive used continuously, the MTBF was 15E5 hours. There were 365 days*24 hours, or 8760 hours in a year. Converting, the drive MTBF was 15E5 hours/ 8760 hours per year, 171.23 years. The percent failure was (1/ MTBF years)*100., (1/171.23)*100, or 0.5840 percent. Meaning, 0.584 percent of the population or drives in service were expected to fail per the average year.
For the push buttons in the eTCL calculator, the recommended procedure is push testcase and fill frame, change first three entries etc, push solve, and then push report. Report allows copy and paste from console. For testcases in a computer session, the eTCL calculator increments a new testcase number internally, eg. TC(1), TC(2) , TC(3) , TC(N). The testcase number is internal to the calculator and will not be printed until the report button is pushed for the current result numbers. The current result numbers will be cleared on the next solve button.
Pseudocode and Equations
  price? = raw materials + labor  +  profit
  price? = raw materials + heat process
  price? = raw materials + labor
  average price per unit  = revenue  / units sold
Testcases Section
Testcase 1
| table 1 | printed in | tcl wiki format |
|---|---|---|
| quantity | value | comment, if any |
| testcase number: | 1 | |
| t1 hours til failure: | 592.0 | |
| t2 hours til failure: | 642.0 | |
| t3 hours til failure: | 595.0 | |
| t4 hours til failure: | 1000.0 | |
| t5 hours til failure: | 1000.0 | |
| t6 hours til failure: | 0.00078349 | |
| per million : | 783.49 | |
| per billion (FIT): | 0.78349 |
Testcase 2
| table 2 | printed in | tcl wiki format |
|---|---|---|
| quantity | value | comment, if any |
| testcase number: | 2 | |
| t1 hours til failure: | 655.0 | |
| t2 hours til failure: | 480.0 | |
| t3 hours til failure: | 602.0 | |
| t4 hours til failure: | 1000.0 | |
| t5 hours til failure: | 1000.0 | |
| t6 hours til failure: | 0.00080278 | |
| per million : | 802.78 | |
| per billion (FIT): | 0.80278 |
Testcase 3
| table 3 | printed in | tcl wiki format |
|---|---|---|
| quantity | value | comment, if any |
| testcase number: | 3 | |
| t1 hours til failure: | 644.0 | |
| t2 hours til failure: | 604.0 | |
| t3 hours til failure: | 650.0 | |
| t4 hours til failure: | 1000.0 | |
| t5 hours til failure: | 1000.0 | |
| t6 hours til failure: | 0.0007696 | |
| per million : | 769.62 | |
| per billion (FIT): | 0.76962 |
Screenshots Section
figure 1.
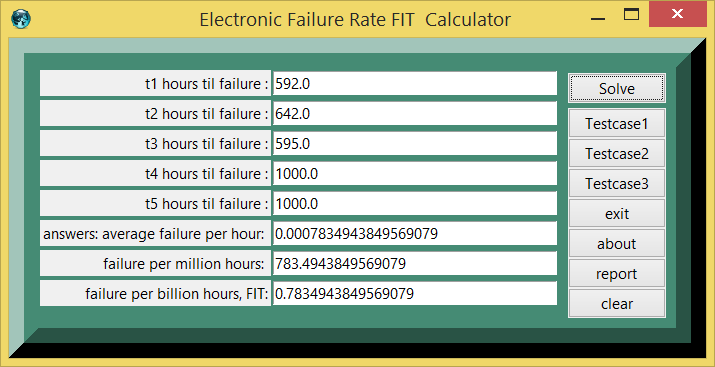
figure. FIT DEFINITION AND UNIT CONVERSIONS
+----------------------------------------------------------------------------------+
| FIT: FAILURES IN TIME -- DEFINITION AND UNIT CONVERSIONS                        |
|                                                                                  |
|    FIT = Failures In Time = failures per billion device-hours                   |
|                           = failures per 1E9 device-hours                       |
|                                                                                  |
|    Starting from raw test data (failures and total device-hours):               |
|                                                                                  |
|    Step 1: Average failure rate (failures per hour)                             |
|      average_rate = N_failures / sum(hours_per_device)                          |
|                                                                                  |
|    Step 2: Convert to failures per million hours                                |
|      f_per_million = average_rate * 1E6                                         |
|                                                                                  |
|    Step 3: Convert to FIT (failures per billion hours)                          |
|      FIT = average_rate * 1E9                                                   |
|          = f_per_million * 1E3 * 0.001 * 1.0                                   |
|          = f_per_million / 1000                                                 |
|                                                                                  |
|    Example (Testcase 1):                                                         |
|      N_failures = 3                                                             |
|      sum_hours  = 592 + 642 + 595 + 1000 + 1000 = 3829 hours                  |
|      average_rate  = 3 / 3829         = 0.0007835 failures/hour                |
|      f_per_million = 0.0007835 * 1E6  = 783.5  f/million hours                 |
|      FIT          = 0.0007835 * 1E9   = 0.7835 failures/billion hours          |
|                                                                                  |
|    Note: this calculator uses less strict definitions and does not              |
|    consider confidence levels, since the goal is a quick estimator.             |
+----------------------------------------------------------------------------------+
figure. TEST TRIAL PROTOCOL: 1000-HOUR REPLACEMENT RULE
+----------------------------------------------------------------------------------+
| TEST TRIAL PROTOCOL: 1000-HOUR REPLACEMENT RULE                                 |
|    Each trial lasts up to 1000 hours.                                           |
|    If a device survives 1000 hours, a new device is switched in.                |
|                                                                                  |
|    Timeline for one device slot:                                                 |
|                                                                                  |
|    |-----device failed------|      <-- records actual hours to failure           |
|    0                        T_fail  (T_fail < 1000)                             |
|                                                                                  |
|    |------------------------1000|  <-- device survived, new device starts       |
|    0                        1000   records T = 1000 (censored / suspended)      |
|                                                                                  |
|    5 devices per testcase:                                                      |
|      T1, T2, T3 = actual failure hours (< 1000 in testcases 1-3)               |
|      T4, T5     = 1000 (both survived full trial = "censored" data)             |
|                                                                                  |
|    Total device-hours = T1 + T2 + T3 + T4 + T5                                 |
|    N failures observed = 3 (devices 1, 2, 3 failed before 1000 h)              |
|                                                                                  |
|    This is a simplified reliability test (no confidence interval applied).      |
+----------------------------------------------------------------------------------+
figure. TESTCASE RESULTS SUMMARY
+----------------------------------------------------------------------------------+
| TESTCASE RESULTS SUMMARY (3 testcases, N_failures = 3 each)                    |
|                                                                                  |
| +----+-------+-------+-------+-------+-------+----------+---------+---------+  |
| | TC |  T1   |  T2   |  T3   |  T4   |  T5   | sum hrs  | f/Mhrs  |  FIT    |  |
| +----+-------+-------+-------+-------+-------+----------+---------+---------+  |
| |  1 | 592.0 | 642.0 | 595.0 |1000.0 |1000.0 |  3829.0  |  783.49 | 0.78349 |  |
| |  2 | 655.0 | 480.0 | 602.0 |1000.0 |1000.0 |  3737.0  |  802.78 | 0.80278 |  |
| |  3 | 644.0 | 604.0 | 650.0 |1000.0 |1000.0 |  3898.0  |  769.62 | 0.76962 |  |
| +----+-------+-------+-------+-------+-------+----------+---------+---------+  |
|                                                                                  |
|    Hand calculator vs eTCL calculator check:                                    |
| +----+-------------------+-------------------+-----------------------------+    |
| | TC | hand calc FIT     | eTCL calc FIT     | notes                       |    |
| +----+-------------------+-------------------+-----------------------------+    |
| |  1 | 0.783             | 0.7349            | extra sig figs for checking |    |
| |  2 | 0.8027            | 0.802             | close agreement             |    |
| |  3 | 0.770             | 0.769             | close agreement             |    |
| +----+-------------------+-------------------+-----------------------------+    |
|                                                                                  |
|    Note: Additional significant figures used to check eTCL calculator,          |
|    NOT to imply accuracy beyond 3 decimal places in real applications.          |
+----------------------------------------------------------------------------------+
figure. MTBF AND MTTF: DEFINITIONS AND EXAMPLES
+----------------------------------------------------------------------------------+
| MTBF AND MTTF: DEFINITIONS AND CALCULATED EXAMPLES                              |
|                                                                                  |
|    MTBF = Mean Time Between Failures                                            |
|      From FIT:    MTBF = 1E9 / FIT   (hours)                                   |
|      From test:   MTBF = total device-hours / N_failures                        |
|                                                                                  |
|    MTTF = Mean Time To Failure                                                  |
|      From test:   MTTF = max_trial_hours  (simpler, all devices = same max)    |
|                        = total_max_hours / N_devices                            |
|                                                                                  |
| +----+---------+---------------------+-------------------+--------------------+|
| | TC |  FIT    | MTBF from FIT (hrs) | MTBF from test    | MTTF from test     ||
| +----+---------+---------------------+-------------------+--------------------+|
| |  1 | 0.78349 | 1E9/0.78349=1.277E9 | 5*1000/3=1667 hrs | 5*1000/5=1000 hrs ||
| |  2 | 0.80278 | 1E9/0.80278=1.245E9 | 5*1000/3=1667 hrs | 5*1000/5=1000 hrs ||
| |  3 | 0.76962 | 1E9/0.76962=1.300E9 | 5*1000/3=1667 hrs | 5*1000/5=1000 hrs ||
| +----+---------+---------------------+-------------------+--------------------+|
|                                                                                  |
|    Disk drive example (continuous use):                                         |
|      Reported MTBF = 1.5E6 hours                                                |
|      Hours per year = 365 * 24 = 8760 hours                                    |
|      MTBF in years = 1.5E6 / 8760 = 171.23 years                               |
|      Annual failure rate = (1/171.23)*100 = 0.584 percent per year              |
|      Meaning: 0.584 pct of drives in service expected to fail per year          |
+----------------------------------------------------------------------------------+
figure. CALCULATE PROC: FORMULA FLOW
+----------------------------------------------------------------------------------+
| CALCULATE PROC: FORMULA FLOW  (proc calculate {})                               |
|                                                                                  |
|    Inputs (global variables side1..side5):                                      |
|      side1 = T1 hours to failure (or 1000 if survived)                         |
|      side2 = T2 hours to failure                                                |
|      side3 = T3 hours to failure                                                |
|      side4 = T4 hours to failure                                                |
|      side5 = T5 hours to failure                                                |
|                                                                                  |
|    Step 1: Force float multiplication (avoid integer division)                  |
|      side1 = side1 * 1.0   (repeated for side1..side8)                         |
|                                                                                  |
|    Step 2: Average failure rate per hour                                        |
|      average_rate = 3.0 / (side1 + side2 + side3 + side4 + side5)              |
|      side6 = average_rate                                                       |
|                                                                                  |
|    Step 3: Failures per million hours                                           |
|      side7 = average_rate * 1.E6 * 1.0                                         |
|                                                                                  |
|    Step 4: FIT (failures per billion hours)                                     |
|      side8 = average_rate * 1.E6 * 0.001 * 1.0                                 |
|            = average_rate * 1.E3                                                |
|                                                                                  |
|    Outputs written back to entry fields side6, side7, side8                    |
|    testcase_number incremented on each Solve press                              |
|                                                                                  |
|    TCL precision: kept at 17 significant figures internally                     |
|    to study algorithms, not to imply accuracy beyond 3 decimal places.          |
+----------------------------------------------------------------------------------+
figure. eTCL SLOT CALCULATOR: GUI LAYOUT
+----------------------------------------------------------------------------------+
| eTCL SLOT CALCULATOR: GUI LAYOUT  (8-entry slot frame)                          |
|                                                                                  |
|    Window title: "Electronic Failure Rate FITS  Calculator"                    |
|    Background: aquamarine4, border raised brown                                 |
|                                                                                  |
|    .frame (left panel):          .buttons (right panel):                        |
|    +---------------------------+ +-----------------------------+                |
|    | t1 hours til failure : [_]| | Solve                       |                |
|    | t2 hours til failure : [_]| | report (console)            |                |
|    | t3 hours til failure : [_]| | self_help                   |                |
|    | t4 hours til failure : [_]| | about                       |                |
|    | t5 hours til failure : [_]| | exit                        |                |
|    | avg failure per hour : [_]| | Testcase3                   |                |
|    | failure per million  : [_]| | Testcase2                   |                |
|    | failure per billion  : [_]| | Testcase1                   |                |
|    | (FIT)                     | +-----------------------------+                |
|    +---------------------------+                                                 |
|                                                                                  |
|    Recommended button sequence:                                                 |
|      1) push Testcase(N)  --> fills all 8 entry fields                          |
|      2) change first 5 entries as needed                                        |
|      3) push Solve        --> calculates entries 6, 7, 8                        |
|      4) push report       --> console shows results for copy/paste              |
+----------------------------------------------------------------------------------+
figure. FILLUP AND CLEARX PROCS
+----------------------------------------------------------------------------------+
| FILLUP AND CLEARX PROCS (testcase preset and field reset)                       |
|                                                                                  |
|    proc fillup {aa bb cc dd ee ff gg hh}:                                       |
|      .frame.entry1 insert 0 $aa    <-- T1                                       |
|      .frame.entry2 insert 0 $bb    <-- T2                                       |
|      .frame.entry3 insert 0 $cc    <-- T3                                       |
|      .frame.entry4 insert 0 $dd    <-- T4                                       |
|      .frame.entry5 insert 0 $ee    <-- T5                                       |
|      .frame.entry6 insert 0 $ff    <-- avg rate/hr (pre-fill or cleared)        |
|      .frame.entry7 insert 0 $gg    <-- f/million hrs                            |
|      .frame.entry8 insert 0 $hh    <-- FIT                                     |
|                                                                                  |
|    proc clearx {}:                                                              |
|      foreach i {1 2 3 4 5 6 7 8}:                                              |
|        .frame.entry$i delete 0 end                                              |
|                                                                                  |
|    Testcase preset values (button commands):                                    |
| +------+---------+---------+---------+-------+-------+---------+--------+-----+|
| | TC   |   T1    |   T2    |   T3    |  T4   |  T5   | rate/hr |f/M hrs | FIT ||
| +------+---------+---------+---------+-------+-------+---------+--------+-----+|
| | TC 1 | 592.0   | 642.0   | 595.0   |1000.  |1000.  | .000783 | 783.   | .783||
| | TC 2 | 655.0   | 480.0   | 602.0   |1000.  |1000.  | 8.03E-4 | 802.78 | .803||
| | TC 3 | 644.0   | 604.0   | 650.0   |1000.  |1000.  | 7.69E-4 | 769.6  | .769||
| +------+---------+---------+---------+-------+-------+---------+--------+-----+|
+----------------------------------------------------------------------------------+
figure. REPORTX PROC: CONSOLE OUTPUT FORMAT
+----------------------------------------------------------------------------------+
| REPORTX PROC: CONSOLE OUTPUT FORMAT  (proc reportx {})                          |
|                                                                                  |
|    Console configuration:                                                        |
|      background: palegreen                                                       |
|      font: fixed 20 bold                                                        |
|      geometry: 40x20                                                            |
|      title: "Electronic Failure Rate Report, screen grab and paste..."          |
|      window: orange, brown highlight, raised, border 30                         |
|                                                                                  |
|    Output format (TCL wiki table format):                                       |
|      %|table N|printed in|tcl format|%                                          |
|      &| quantity | value | comment |&                                           |
|      &| testcase number:   | N      |        |&                                 |
|      &| t1 hours til failure: | T1  |        |&                                 |
|      &| t2 hours til failure: | T2  |        |&                                 |
|      &| t3 hours til failure: | T3  |        |&                                 |
|      &| t4 hours til failure: | T4  |        |&                                 |
|      &| t5 hours til failure: | T5  |        |&                                 |
|      &| t6 hours til failure: | avg |        |&   <- avg failures/hr            |
|      &| per million :        | f/M  |        |&   <- f/million hours            |
|      &| per billion (FIT):   | FIT  |        |&   <- FIT                        |
|                                                                                  |
|    testcase_number: internal counter, incremented each Solve press              |
|    NOT printed until report button pushed for current result                    |
|    Current results cleared on next Solve press                                  |
+----------------------------------------------------------------------------------+
figure. FAILURE RATE UNIT SCALE LADDER
+----------------------------------------------------------------------------------+
| FAILURE RATE UNIT SCALE LADDER                                                   |
|                                                                                  |
|    failures per hour          0.0007835   (direct from test data)               |
|         |                                                                        |
|         x 1E3                                                                    |
|         v                                                                        |
|    failures per 1000 hours    0.7835      (kilo-hour rate, MTBF reciprocal)     |
|         |                                                                        |
|         x 1E3                                                                    |
|         v                                                                        |
|    failures per million hours 783.5       (common industrial unit)              |
|         |                                                                        |
|         x 1E3                                                                    |
|         v                                                                        |
|    failures per billion hours 0.7835 FIT  (aerospace / semiconductor unit)     |
|    (1 FIT = 1 failure per 1E9 device-hours)                                     |
|                                                                                  |
|    Practical size perspective:                                                   |
|      1 billion hours = 114,155 years  (for a single device)                     |
|      OR = 1 million devices each running 1000 hours                             |
|                                                                                  |
|    MTBF from FIT (Testcase 1):                                                  |
|      MTBF = 1E9 / FIT = 1E9 / 0.783 = 1.277E9 hours = 145,776 years           |
+----------------------------------------------------------------------------------+
figure. LED LIGHTBULB CONTEXT AND ASSUMPTIONS
+----------------------------------------------------------------------------------+
| LED LIGHTBULB CONTEXT AND ASSUMPTIONS                                           |
|    Impetus: reported failure rates in light emitting diode (LED) lightbulbs     |
|                                                                                  |
|    Test setup assumptions (rules of thumb):                                     |
|      5 devices per testcase batch                                                |
|      Trial duration: up to 1000 hours per device slot                           |
|      3 devices failed before 1000 hours in each testcase                        |
|      2 devices survived 1000 hours (censored/suspended data)                   |
|                                                                                  |
|    Testcase results in context:                                                  |
| +----+-------+----------+---------------+-----------------------------+         |
| | TC |  FIT  | MTBF(hrs)| MTBF(yrs)    | notes                       |         |
| +----+-------+----------+---------------+-----------------------------+         |
| |  1 | 0.783 | 1.277E9  | 145,776 yrs  | typical LED lifetime claim  |         |
| |  2 | 0.803 | 1.245E9  | 142,123 yrs  | batch with shorter failures |         |
| |  3 | 0.770 | 1.300E9  | 148,400 yrs  | batch with longer failures  |         |
| +----+-------+----------+---------------+-----------------------------+         |
|                                                                                  |
|    Note: MTBF from FIT formula gives theoretical device-population MTBF.        |
|    Test MTBF = 5*1000/3 = 1667 hours (what the experiment directly shows).     |
|    The two MTBF values serve different purposes:                                |
|      Test MTBF:  reflects observed batch failure rate                           |
|      FIT MTBF:   extrapolated population-level reliability estimate             |
+----------------------------------------------------------------------------------+
figure. PSEUDOCODE AND PRICE EQUATIONS (from page)
+----------------------------------------------------------------------------------+
| PSEUDOCODE AND PRICE EQUATIONS (from Pseudocode and Equations section)          |
|                                                                                  |
|    price? = raw materials + labor + profit                                      |
|    price? = raw materials + heat process                                        |
|    price? = raw materials + labor                                               |
|    average price per unit = revenue / units sold                                |
|                                                                                  |
|    Note: these price pseudocode lines are included in the page as a             |
|    reminder that FIT calculators are embedded in larger cost models.            |
|    Device cost, replacement cost, and field service cost all depend             |
|    on failure rates.                                                             |
|                                                                                  |
|    Full cost model context:                                                     |
|    +--------------------------------+----------------------------------------+  |
|    | cost element                   | relationship to FIT                    |  |
|    +--------------------------------+----------------------------------------+  |
|    | raw materials per unit         | direct (higher quality = lower FIT)    |  |
|    | manufacturing heat process     | affects junction temperature = FIT     |  |
|    | field replacement labor        | = failures/year * labor cost           |  |
|    | warranty reserve               | = FIT * units_in_field * cost/failure  |  |
|    | revenue per unit               | must cover warranty reserve            |  |
|    +--------------------------------+----------------------------------------+  |
|                                                                                  |
|    Console paste-and-try examples from self_help:                               |
|      set answer [* 1. 2. 3. 4. 5.]          --> 120                            |
|      set factor2 [expr {(1-1./3)*(1-1./3)}] --> 0.4444                         |
|      set factor3 [expr {(1-1./5)**5}]        --> 0.32768                        |
|      set factor4 [expr {(1+1./5)**5}]        --> 4.21399                        |
+----------------------------------------------------------------------------------+
figure. OVERALL PROGRAM FLOW
+----------------------------------------------------------------------------------+
| OVERALL PROGRAM FLOW  (Electronic Failure Rate FITS Calculator V2)              |
|    gold on TCL Club, 1Dec2018                                                   |
|                                                                                  |
|    package require Tk                                                            |
|    namespace path {::tcl::mathop ::tcl::mathfunc}                               |
|         |                                                                        |
|         v                                                                        |
|    Build .frame (8 label+entry pairs, grid layout)                             |
|    Build .buttons (Solve, report, self_help, about, exit, TC3, TC2, TC1)       |
|    grid .frame .buttons -sticky ns                                              |
|         |                                                                        |
|         v                                                                        |
|    User pushes Testcase(N) button:                                              |
|      clearx  --> fillup (preset T1..T5 + pre-calculated outputs)               |
|         |                                                                        |
|         v                                                                        |
|    User edits T1..T5 entries if needed                                          |
|         |                                                                        |
|         v                                                                        |
|    User pushes Solve:                                                           |
|      calculate --> average_rate, side7 (f/M), side8 (FIT)                      |
|      results written to entry6, entry7, entry8                                  |
|      testcase_number incremented                                                 |
|         |                                                                        |
|         v                                                                        |
|    User pushes report:                                                          |
|      reportx --> console show (palegreen, fixed 20 bold)                        |
|      puts wiki-format table with all 8 values + testcase number                 |
|      copy/paste from console to text editor for permanent record                |
+----------------------------------------------------------------------------------+
References:
- Failure rate ref. Dr. A.K. Nema
- NIST/SEMATECH e-Handbook of Statistical Methods [L1 ]
Appendix Code
appendix TCL programs and scripts
        # TCL source code follows
        # pretty print from autoindent and ased editor
        # Electronic failure rate FITS calculator
        # written on Windows XP on TCL
        # working under TCL version 8.6
        # gold on TCL club, 1dec2018
        package require Tk
        namespace path {::tcl::mathop ::tcl::mathfunc}
        frame .frame -relief flat -bg aquamarine4
        pack .frame -side top -fill y -anchor center
        set names {{} {t1 hours til failure :} }
        lappend names {t2 hours til failure :}
        lappend names {t3 hours til failure :}
        lappend names {t4 hours til failure :}
        lappend names {t5 hours til failure :}
        lappend names {answers: average failure per hour: }
        lappend names {failure per million hours: }
        lappend names {failure per billion hours, FIT:}
        foreach i {1 2 3 4 5 6 7 8} {
            label .frame.label$i -text [lindex $names $i] -anchor e
            entry .frame.entry$i -width 35 -textvariable side$i
            grid .frame.label$i .frame.entry$i -sticky ew -pady 2 -padx 1 }
        proc about {} {
            set msg "Calculator for Electronic Failure Rate FITS V2
            from TCL,
            # gold on TCL club, 1Dec2018 "
            tk_messageBox -title "About" -message $msg }
        proc self_help {} {
            set msg "Electronic Failure Rate FIT V2
            from TCL ,
            # self help listing
            # problem is Electronic Failure Rate FITS
            # 5 givens follow.
            1) t1 hours til failure
            2) t2 hours til failure
            3) t3 hours til failure
            4) t4 hours til failure
            5) t5 hours til failure
            The  TCL calculator solution is kept in { TCL precision 17 } to study
            the  algorithms, not to imply accuracy beyond 3 decimal places
            or accuracy beyond the numbers on the textbooks.
            # This posting, screenshots, and TCL source code is
            # copyrighted under the TCL/TK license terms.
            # Editorial rights and disclaimers
            # retained under the TCL/TK license terms
            # and will be defended as necessary in court.
            # >>>>   Push Button Operation <<<<
            # Recommended procedure is push testcase and fill frame,
            # change first three entries etc, push solve,
            # and then push report. Report allows copy and paste
            # from console to conventional texteditor. For testcases,
            # the testcase number is internal to the calculator and
            # will not be printed until the report button is pushed
            # for the current result numbers.
            # Where the program defaults are recalled,
            # canvas colors/features/variables/globals/calculations/clear displays
            # are reset prior to calculation  ( in push button list) .
            # Buttons on the calculator are not limited to a single action procedure
            # or single shot. A button command may call multiple statements and procs,
            # effectively a separate program or subprogram installed as
            # a list of procedures in a button. Alternately, the list of procedures
            # need not be installed in a button, but in a separate procedure.
            Conventional text editor formulas or  grabbed from internet
            screens can be pasted into green console.
            Try copy and paste following into green screen console, rm 1st #
            # set answer [* 1. 2. 3. 4. 5. ] # answer returns 120
            # set factor2 [ expr {(1-1./3)* (1-1./3)} ] # answer 0.4444
            # set factor1 [ expr {(1+1./3)* (1+1./3)} ] # answer 1.7777
            # set factor3 [ expr {(1-1./5)**5} ]  # answer 0.32768
            # set factor4 [ expr {(1+1./5)**5} ]  # answer 4.21399
            # gold on  TCL Club, 1Dec2018 "
            tk_messageBox -title "Self_Help" -message $msg }
        proc calculate {     } {
            global answer2
            global side1 side2 side3 side4 side5
            global side6 side7 side8
            global testcase_number
            incr testcase_number
            set side1 [* $side1 1. ]
            set side2 [* $side2 1. ]
            set side3 [* $side3 1. ]
            set side4 [* $side4 1. ]
            set side5 [* $side5 1. ]
            set side6 [* $side6 1. ]
            set side7 [* $side7 1. ]
            set side8 [* $side8 1. ]
            set average_rate [/ 3.  [+ $side1 $side2 $side3 $side4 $side5 ]  ]
            set side6 $average_rate
            set side7 [* $average_rate 1.E6 1. ]
            set side8 [* $average_rate 1.E6 .001 1. ]
        }
        proc fillup {aa bb cc dd ee ff gg hh} {
            .frame.entry1 insert 0 "$aa"
            .frame.entry2 insert 0 "$bb"
            .frame.entry3 insert 0 "$cc"
            .frame.entry4 insert 0 "$dd"
            .frame.entry5 insert 0 "$ee"
            .frame.entry6 insert 0 "$ff"
            .frame.entry7 insert 0 "$gg"
            .frame.entry8 insert 0 "$hh"
        }
        proc clearx {} {
            foreach i {1 2 3 4 5 6 7 8 } {
                .frame.entry$i delete 0 end } }
        proc reportx {} {
            global side1 side2 side3 side4 side5
            global side6 side7 side8
            global testcase_number
            console show;
            console eval {.console config -bg palegreen}
            console eval {.console config -font {fixed 20 bold}}
            console eval {wm geometry . 40x20}
            console eval {wm title . "Electronic Failure Rate Report  , screen grab and paste from console 2 to texteditor"}
            console eval {. configure -background orange -highlightcolor brown -relief raised -border 30}
            puts "%|table $testcase_number|printed in| tcl  format|% "
            puts "&| quantity | value| comment, if any|& "
            puts "&| testcase number:|$testcase_number | |&"
            puts "&|  t1 hours til failure:|$side1|   |&"
            puts "&|  t2 hours til failure:|$side2| |& "
            puts "&|  t3 hours til failure:|$side3| |& "
            puts "&|  t4 hours til failure:|$side4|  |&"
            puts "&|  t5 hours til failure:|$side5|  |&"
            puts "&|  t6 hours til failure:|$side6|  |&"
            puts "&|per million :| $side7 |  |&"
            puts "&|per billion (FIT):| $side8 |  |&"
        }
        frame .buttons -bg aquamarine4
        ::ttk::button .calculator -text "Solve" -command { calculate   }
        ::ttk::button .test2 -text "Testcase1" -command {clearx;fillup 592. 642.0 595.0 1000.   1000. .000783 783. .783}
        ::ttk::button .test3 -text "Testcase2" -command {clearx;fillup 655. 480.0 602.0 1000.   1000.  8.03E-4 802.78 .8028 }
        ::ttk::button .test4 -text "Testcase3" -command {clearx;fillup 644. 604.0 650.0 1000.   1000. 7.69E-4  769.6 0.769 }
        ::ttk::button .clearallx -text clear -command {clearx }
        ::ttk::button .self_help -text self_help -command {self_help}
        ::ttk::button .about -text about -command about
        ::ttk::button .cons -text report -command { reportx }
        ::ttk::button .exit -text exit -command {exit}
        pack .calculator  -in .buttons -side top -padx 10 -pady 5
        pack  .clearallx .cons .self_help .about .exit .test4 .test3 .test2   -side bottom -in .buttons
        grid .frame .buttons -sticky ns -pady {0 10}
        . configure -background aquamarine4 -highlightcolor brown -relief raised -border 30
        wm title . "Electronic Failure Rate FITS  Calculator "
Comments Section
Please place any comments here with your wiki MONIKER and date, Thanks.
| Category Numerical Analysis | Category Toys | Category Calculator | Category Mathematics | Category Example | Toys and Games | Category Games | Category Application | Category GUI |