Mapping Colorado
Richard Suchenwirth 2002-01-30 - I've so long dreamt of Geographic mapping the Tcl way; now I finally got started with a simple example, which hopefully still conveys some of these four-fifth baked ideas:
mapping the US state of Colorado. Colorado is a simple case because of its rectangular shape, so for a quick and dirty map, a rect canvas item would be sufficient. But in order to prepare for more general maps, it is better to reflect the fact that the boundary of Colorado has seven characteristic points, where two or more states meet.
A first consideration is that geographic points are valuable detail knowledge, which should only be stored (with latitude, longitude, and optional elevation data) in one place, so it can be shared by adjacent areas. Sequences of two or more points make lines, sequences of two or more lines make areas, all of which shall be kept in a database. But in order to start top-down, let's wrap the data (geo coordinates are just rough estimates) for this example into a procedure:
 proc CO {} {
    geo'set {
        Colorado area     CO-KS CO-NB CO-WY CO-UT CO-NM CO-OK
        CO-KS    boundary CO.KS.OK CO.KS.NB
        CO-NB    boundary CO.KS.NB {102 41} CO.NB.WY
        CO-WY    boundary CO.NB.WY CO.UT.WY
        CO-UT    boundary CO.UT.WY AZ.CO.NM.UT
        CO-NM    boundary AZ.CO.NM.UT CO.NM.OK
        CO-OK    boundary CO.NM.OK CO.KS.OK
        # comments in data are sort of allowed (leave blank after #)
        CO.KS.OK point    102 36
        CO.KS.NB point    102 40
        CO.NB.WY point    103.5 41
        CO.UT.WY point    109 41
        AZ.CO.NM.UT point 109 36
        CO.NM.OK point    103 36
        # Now for some more details...
        Denver             city 105.0 39.7
        {Colorado Springs} city 104.9 38.5
        {Cheyenne, WY}     city 104.8 41.3
        {Raton, NM}        city 104.5 35.8
        I-25     road  {Cheyenne, WY} Denver {Colorado Springs} {Raton, NM}
        Aspen              city 107 39
    }
 }
Whew. Pretty much code for just drawing a rectangle - but we have used geographical coordinates (which can be scaled and translated however we wish) and factored out common data (the boundary with e.g. Wyoming could be reused if we wish to map that state...) Obviously, points, boundaries and areas may be kept in a simple database implemented as an array, whose keys (just strings, but note the naming conventions I've introduced) map to values that are again strings. Alright, let's implement:
proc geo'set args {
global geo ;# the array that holds our database
if {[llength $args]==1} {set args [lindex $args 0]}
foreach line [split $args \n] {
if {[llength $line] && [lindex $line 0]!="#"} {
set geo([lindex $line 0]) [lrange $line 1 end]
}
}
}
proc geo'get arg {
global geo
if {[info exists geo($arg)]} {
set value $geo($arg)
} else {
set value [concat point $arg]
}
set rest [lrange $value 1 end]
switch -- [lindex $value 0] {
area {set res [geo'make polygon $rest]}
boundary {set res [geo'make line $rest]}
city {set res [geo'city $arg]}
point {
foreach {x y} $rest break
set res [list point [expr {-$x}] [expr {-$y}]]
}
road {set res [geo'make line $rest]}
default {return -code error "cannot get $arg"}
}
geo'join $res
}
proc geo'make {item argl} {
foreach arg $argl {
eval lappend item [lrange [geo'get $arg] 1 end]
}
geo'join $item
}
proc geo'city name {
global geo
foreach {x y} [lrange $geo($name) 1 2] break
concat oval [expr {-$x}] [expr {-$y}] [expr {-$x+.15}] [expr {-$y+.15}]
}
proc geo'join list {
set res [lrange $list 0 2]
set lastx [lindex $res 1]
set lasty [lindex $res 2]
foreach {x y} [lrange $list 3 end] {
if {$x!=$lastx || $y!=$lasty} {
lappend res $x $y
}
set lastx $x
set lasty $y
}
join $res
}
# Rendering is done with an overloaded canvas:
proc geo'map {w args} {
eval canvas $w $args ;# create the base widget
rename $w _$w
proc $w {cmd args} [string map [list @w@ _$w] {
global geo
set w [lindex [info level 1] 0]
set name [lindex $args 0]
set rest [lrange $args 1 end]
switch -- $cmd {
show {
set data [geo'get $name]
set item [eval _$w create $data]
if {[lindex $geo($name) 0]=="city"} {
_$w itemconfig $item -fill orange
eval _$w create text [lrange $data 1 2] \
[list -text " $name" -anchor w]
}
eval _$w itemconfig $item $rest
}
default {eval @w@ $cmd $args}
}
}]
set w
}
#Testing...
CO ;# fill database
pack [geo'map .c]
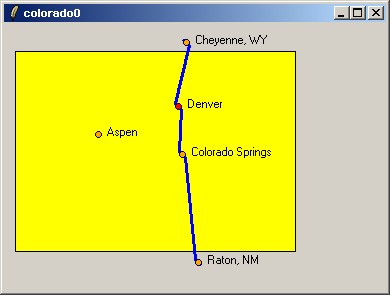
.c show Colorado -fill yellow -outline black
.c show I-25 -width 3 -fill blue
.c show Denver -fill red
.c show {Cheyenne, WY}
.c show {Raton, NM}
.c show Aspen
.c show {Colorado Springs}
.c scale all 0 0 40 40
foreach {x y} [.c bbox all] break
.c move all [expr {-$x+10}] [expr {-$y+10}]The day after I wrote this, Kevin Kenny pointed me to free geodata (coastlines for the whole world), so this quickly evolved into Tclworld which is however still in pre-alpha. The whole world offers more challenges than Colorado does...;-)