New plot types in Plotchart (May 2023)
(Arjen Markus) I just added two more features to Plotchart: violin plots as an alternative to box-and-whisker plots and a diagram type to draw hierarchical data in the form of a (simple) dendrogram.
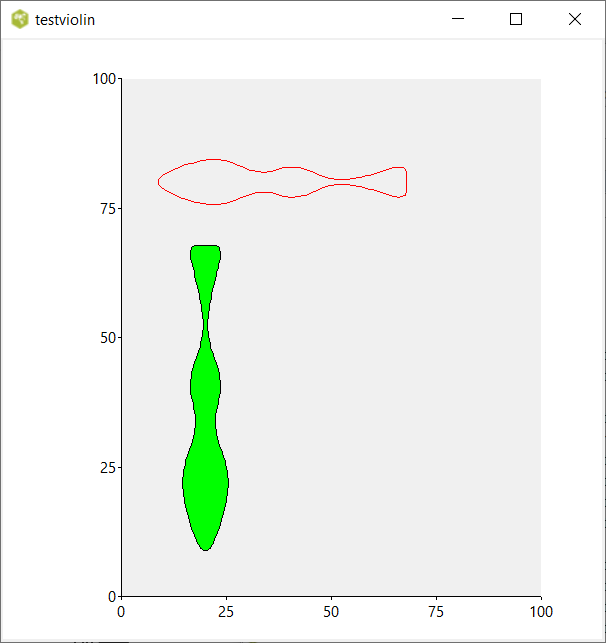
Below is an example of a violin plot:
It was created with this code:
# testviolin.tcl --
# Test/demonstrate the violin subcommand
#
package require Plotchart 2.6.0
pack [canvas .c -width 600 -height 600]
set p [::Plotchart::createXYPlot .c {0.0 100.0 25.0} {0.0 100.0 25.0}]
#
# Completely arbitrary set of data
#
set data {10.0 11.0 9.4 20.0 23.0 23.4 22.0 27.0 35.0 35.1 35.0 60.0 63.0 65.0 56.0}
$p dataconfig vertical -fillcolour lime
$p dataconfig horizontal -colour red
$p violin vertical 20.0 $data
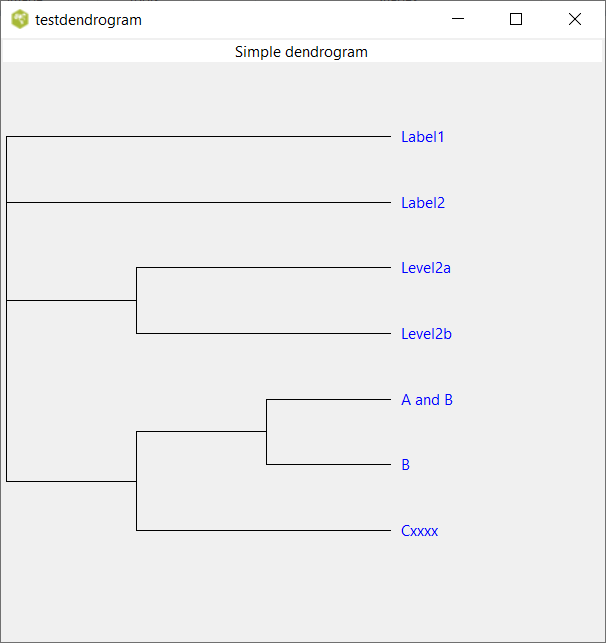
$p violin horizontal $data 80.0 An example of a dendrogram:
And the code:
# testdendrogram.tcl --
#     Test/demo for plotting dendrograms
#
package require Plotchart 2.6.0

pack [canvas .c -width 600 -height 600]

set p [::Plotchart::createDendrogram .c -extend 1 -direction left-right]

#
# Data for the dendrogram: a nested list, each level representing a new fork
#
# Expected:
#                             +
#           +----------------------------+--------------------+
#         Label1          Label2         |                    |
#                                  +-----+-----+         +---------+
#                                Level2a   Level2b       |         C
#                                                    +---+---+
#                                                    A      B
set data {
    "Label1"  "Label2" {"Level2a" "Level2b"} {{{LEAF A and B} B} Cxxxx}
}

$p dataconfig data -labelcolour blue

$p title "Simple dendrogram"
$p plot data $data