Prometheus metrics server
Below is a simple server for Prometheus metrics. The code also has classes to represent Prometheus counters and gauges.
package require TclOO

# Helper for callback functions
proc oo::Helpers::mycode {args} {
    list namespace inscope [uplevel 1 {namespace current}] [linsert $args 0 my]
}

# Base class for Prometheus metrics:
#
# type  : type of the metric, one of: counter, gauge
# name  : name of the metric, no spaces allowed
# help  : help text for the metric
# labels: set of labels for the metric

oo::class create PrometheusMetric {
    variable type name help labels
    constructor {itype iname ihelp args} {
        set type $itype
        set name $iname
        set help $ihelp
        set labels $args
    }
    method format_help {} {
        return "\# HELP $name $help"
    }
    method format_type {} {
        return "\# TYPE $name $type"
    }
    method format_value {value} {
        set result "$name"
        if {[llength $labels]} {
            set L {}
            foreach {k v} $labels {
                lappend L "$k=\"$v\""
            }
            append result "\{"
            append result [join $L ","]
            append result "\}"
        }
        append result " " $value
        return $result
    }
}

# Counter metric
oo::class create PrometheusCounter {
    superclass PrometheusMetric
    variable counter
    constructor {iname ihelp args} {
        set counter 0
        next counter $iname $ihelp {*}$args
    }
    method inc {{v 1}} { set counter [expr {$counter + $v}] }
    method metric {} {
        return "[my format_help]\n[my format_type]\n[my format_value $counter]\n"
    }
}

# Gauge metric
oo::class create PrometheusGauge {
    superclass PrometheusMetric
    variable value
    constructor {iname ihelp args} {
        set value 0
        next gauge $iname $ihelp {*}$args
    }
    method inc {{v 1}} { set value [expr {$value + $v}] }
    method dec {{v 1}} { set value [expr {$value - $v}] }
    method set_value {v} { set value $v }
    method metric {} {
        return "[my format_help]\n[my format_type]\n[my format_value $value]\n"
    }
}

# simple server the Prometheus scraper can use to get metrics
oo::class create PrometheusMetricsServer { # Based on dustmote
    variable port metrics server
    constructor {iport imetrics} {
        set port $iport
        set metrics $imetrics
        set server [socket -server [mycode answer] $port]
    }
    destructor {
        close $server
    }
    method answer {socketChannel host2 port2} {
        fileevent $socketChannel readable [mycode process_request $socketChannel]
    }
    method process_request {socketChannel} {
        fconfigure $socketChannel -blocking 0
        set gotLine [gets $socketChannel]
        if { [fblocked $socketChannel] } then {return}
        fileevent $socketChannel readable ""
        puts $gotLine
        fconfigure $socketChannel -translation binary -buffering full
        puts $socketChannel "HTTP/1.0 200 OK"
        puts $socketChannel ""
        foreach p $metrics {
            puts $socketChannel [$p metric]
        }
        close $socketChannel
    }
}
The example below creates 2 counters and 2 gauges and starts a server on port 8043 Prometheus can scrape:
# Create some metrics
set P {}
lappend P [PrometheusCounter new counter1 "Help for c1" a 1 b 1]
lappend P [PrometheusCounter new counter1 "Help for c1" a 1 b 2]
lappend P [PrometheusGauge new gauge1 "Help for g1" a 2 b 1]
lappend P [PrometheusGauge new gauge1 "Help for g1" a 2 b 2]

# Create the metrics server
PrometheusMetricsServer create s1 8043 $P

# Update the metrics every second
proc update_metrics {} {
    puts "Update metrics"
    foreach p $::P {
        switch -exact -- [info object class $p] {
            ::PrometheusCounter {
                $p inc [expr {rand()}]
            }
            ::PrometheusGauge {
                if {[expr {rand()}] >= 0.5} {
                    $p inc [expr {rand()}]
                } else {
                    $p dec [expr {rand()}]
                }
            }
        }
    }
    after 1000 update_metrics
}

update_metrics

# Let the application run
proc bgerror {trouble} {puts stdout "bgerror: $trouble"}
vwait forever
Let Prometheus know the metrics server is available at port 8043 by listing it as scrape target in the prometheus.yml config file
scrape_configs:
# The job name is added as a label `job=<job_name>` to any timeseries scraped from this config.
- job_name: "prometheus"
# metrics_path defaults to '/metrics'
# scheme defaults to 'http'.
static_configs:
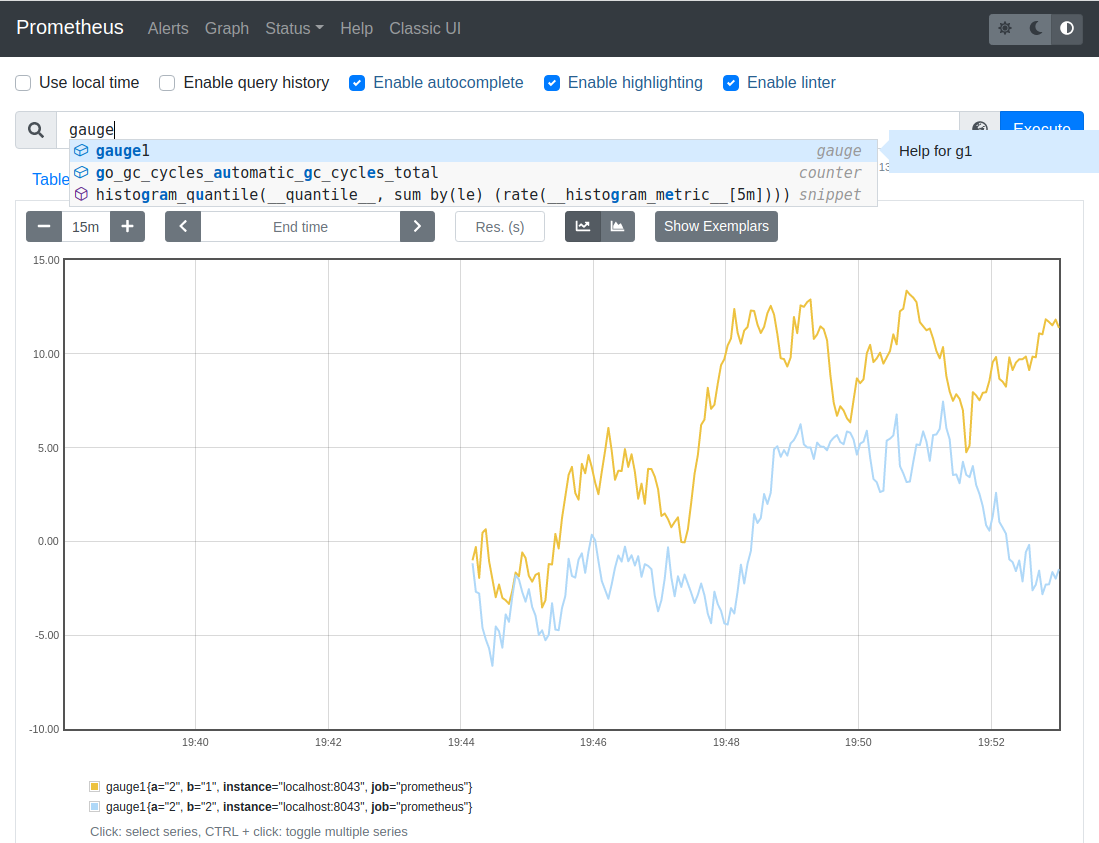
- targets: ["localhost:9090", "localhost:8043"]Below you can see how the 2 gauges (with different labels) look in Prometheus: