Recursive curves
if 0 {Richard Suchenwirth 2004-01-18 - The C curve is a quite beautiful image created by a simple recursive function, originally described by William Gosper. I met it in the Winston/Horn book on LISP and of course wanted to have it in Tcl/Tk too, and on my PocketPC. Translation wasn't difficult - somehow Tcl is "the LISP of the 21st century".
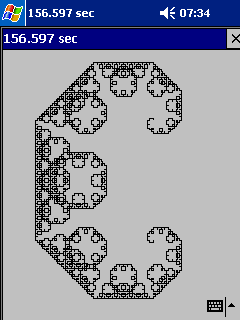

As the code is a bit slow on PocketPC (171 sec for the C curve, 615 sec for the dragon curve!), I chose to update the canvas after every line segment is drawn, for animation. Also, the related but very different dragon curve was added - I think fractals developed from these studies. So here is yet another weekend fun project, which again demonstrates interesting things in few lines of code:
Question: does the PocketPc have a float coprocessor? If not, the difference with Recursive curves (table based) could be huge.
KPV See also Dragon Curve.
KBK The dragon curve is closely related to the Penney numerals, an interesting binary system for encoding complex numbers.
}
 proc main {} {
    pack [canvas .c -width 240 -height 280]
    set ::x0 150; set ::y0 190
    set ::pi_4 [expr atan(1)]
 # ETFS configurability: uncomment what you want
    set t [time {ccurve .c 120 0 2}]
    #set t [time {dragon .c 160 0 1 2.4}]
    wm title . "[expr {[lindex $t 0]/1000000.}] sec"
    bind . <Return> {exec wish $argv0 &; exit}
 }
# C curve drawer, translated from Lisp
 proc ccurve {w len angle minlen} {
    if {$len<$minlen} {
       plotline $w $len $angle
    } else {
       set len [expr {$len/sqrt(2)}]
       ccurve $w $len [expr {$angle+$::pi_4}] $minlen
       ccurve $w $len [expr {$angle-$::pi_4}] $minlen
    }
 }
# Dragon curve drawer
 proc dragon {w len angle s minlen} {
    global pi_4
    if {$len<$minlen} {
       plotline $w $len $angle
    } else {
       set len [expr {$len/sqrt(2)}]
       dragon $w $len [expr {$angle+$s*$pi_4}] 1 $minlen
       dragon $w $len [expr {$angle-$s*$pi_4}] -1 $minlen
    }
 }
# Plot a line from last end point in specified direction and length
 proc plotline {w len ang} {
    global x0 y0
    update
    set x [expr {$x0-$len*sin($ang)}]
    set y [expr {$y0-$len*cos($ang)}]
    $w create line $x0 $y0 $x $y
    set x0 $x; set y0 $y
 }
# Let's go!
main
NEM Very nice. Of course, the [update] call in the code slows it down quite a lot. ccurve takes just over 2 seconds with the update on my box (2.4GHz pentium4), while without the update takes just 0.12 seconds. A marginal speed increase can be had by precomputing the sqrt(2). To get a trade-off between speed and updating the GUI, perhaps it would be better to update the screen once a second or so:
 proc plotline {w len ang} {
     global x0 y0 time
     if {[clock seconds] > $time} { update; set time [clock seconds] }
     set x [expr {$x0-$len*sin($ang)}]
     set y [expr {$y0-$len*cos($ang)}]
     $w create line $x0 $y0 $x $y
     set x0 $x; set y0 $y
 }
 set ::time [clock seconds]
 main
I haven't tested this as it takes less than a second to run on my machine at uni.
MS proposes the following: first replace in main
set ::x0 150; set ::y0 190
by
set ::points {150 190}and then redefine plotline to draw only every say 100 points, using a single call to the canvas.
 set count0 100
 set count  100
 proc plotline {w len ang} {
    global points
    set x0 [lindex $points end-1]
    set y0 [lindex $points end]
    set x [expr {$x0-$len*sin($ang)}]
    set y [expr {$y0-$len*cos($ang)}]
    lappend points $x $y
    if {![incr ::count -1]} {
       $w create line $points
       set points [list $x $y]
       update
       set ::count $::count0
    }
 }
This is noticeably faster already: on my machine the c-curve takes 0.2 sec (down from 4 sec), the dragon curve takes 0.6 sec (down from 16 sec).
Further optimisations are possible in the algorithm itself: inlining the values of 'sqrt(2)' and 'pi_4', replacing the second recursive call by a while loop, maybe specialised trig computations. But the effect will not be as large as this.
RS: Hm... is this worse in performance? At least it's simpler (and brings runtime on the iPaq down to 12 resp. 20 sec):
 proc plotline {w len ang} {
    global points
    set x [expr {[lindex $points end-1]-$len*sin($ang)}]
    set y [expr {[lindex $points end]-$len*cos($ang)}]
    if {[llength [lappend points $x $y]]>200} {
       $w create line $points
       set points [list $x $y]
       update
    }
 }
MS notes that it is indeed simpler ... and probably faster too. Even faster is
 proc plotline {w len ang} {
    global points
    lappend points [expr {[lindex $points end-1]-$len*sin($ang)}]
    lappend points [expr {[lindex $points end-1]-$len*cos($ang)}]
    if {[llength points]>200} {
       $w create line $points
       set points [lrange $point end-1 end]
       update
    }
 }
Just for the sake of it: most floating point operations can be eliminated, as shown in Recursive curves (table based). But it is not that much faster.