Voronoi Maps
ABU 15-jan-2022
Voronoi is s a multiplatform binary package for computing a 2D partition of the plane around some points (seeds). See Wikipedia for an introduction https://en.wikipedia.org/wiki/Voronoi_diagram
This package contains prebuilt binaries for Windows, Linux and MacOS, the reference documentation, and some small demos you can play with.
Note that this package does not require Tk; it just returns the computed Voronoi geometries as a (long) list of polygons and other auxiliary data (..read the doc). You are then free to render these geometries in a tk-canvas (as shown with the included demos), in another graphical backend (? SVG), or in another application
- These Voronoi diagrams are computed using the jc_voronoi C library from https://github.com/JCash/voronoi . It's fast and very simple to use, but the underlying floating-point arithmetic is not very robust, so you could find approximated vertices and edges. I can recommend it just for simple graphics. If anyone has suggestions for a better C/C++ library, please leave comments in the "Implementation and Alternatives" section at the bottom of this page.
 |  |
Download
Version 1.0 (15-jan-2022)
- [L1 ] Voronoi-1.0 contains a prebuilt binary extension for Windows (x32/x64), Linux (x32/x64) and MacOS.
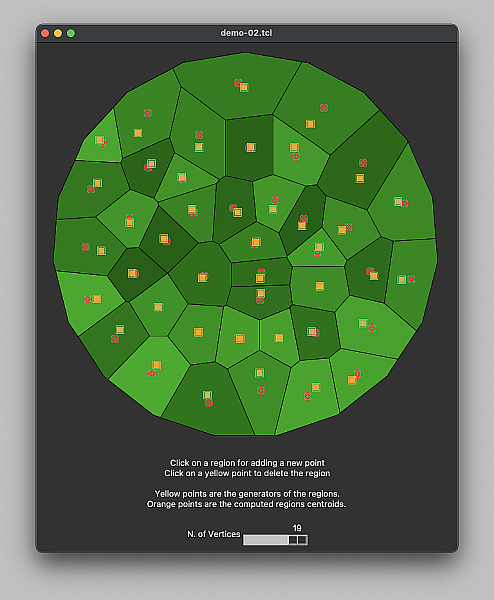
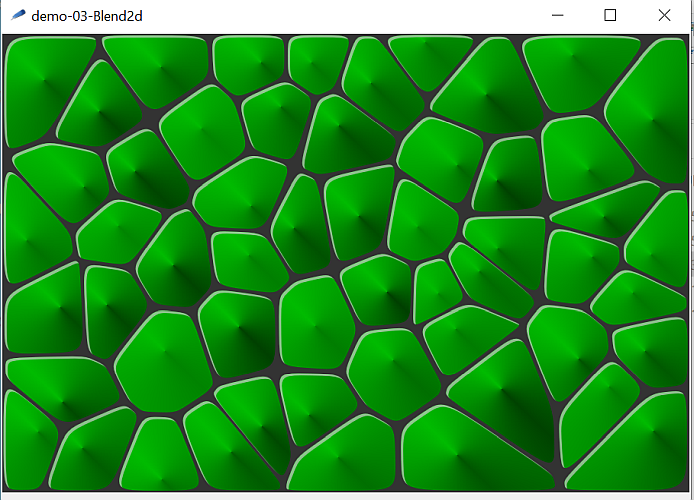
Just for a quick preview, you can play with some included demos even without installing it under a directory pointed by auto_path ; just unzip it under any directory and run "wish demo/demo-01.tcl".
For a full working installation, install the package as a subdirectory of one of the directories given by the auto_path variable.
- [L2 ] Voronoi-1.x Development-Kit for developers/maintainers.
Voronoi

2D Voronoi Maps generator - Version 1.0

SYNOPSIS
        package require Voronoi
        Voronoi _list_of_seeds_ ?-clip _clip_area_?

DESCRIPTION
The Voronoi command takes a _list_of_seeds_ (i.e. a list of 2D points) and an
optional _clip_area_ and returns a list of cells (or regions) describing the
geometry of each area growing around each seed.

A _list_of_seeds_ can be expressed
   as a list of coordinate pairs   {x0 y0  x1 y1 ......}
 or
   as a list of 'points'            {{x0 y0} {x1 y1} ...}

If the _clip_area_ is not specified, an automatic clip-box is calculated, with
extra padding of 10 units.
In general, a clip-area is a *convex* polygon whose vertices are expressed as
a list of coordinates or as a list of 'points', using the same notation
(coords or points) used for the input seeds. As a shorthand, the geometry for
a rectangular clip-area can be specified with just two vertices as {xmin ymin
xmax ymax} or as {{xmin ymin} {xmax ymax}}

All input-seeds outside the clip-area will be excluded.


The result is a list of *regions*, one for each input seed (except those seeds
outside the clip area).
A *region* is a tcl-dictionary with the following entries:
  "vertices" ::  list of the vertices of the region (enumerated in CCW order)
  "seed-idx" ::  integer 0..N - it refers to the i-th input seed
                 (indices are numbered starting from 0)
  "seed-xy"  ::  a list of two numbers - the x,y coords of the i-th input seed
  "centroid" ::  a list of two numbers - the computed centroid of the region
  "area"     ::  the computed area of the region
  "neighbors"::  a list of integers - list of neighbors seed-idx  (see below)
plus some optional entries:
  "fix       ::  "true" if edge-loop has been fixed for this region (see below)
                 (if the fix was not applied, this entry is not added)

*** NOTES:

"vertices" in the "vertices" list will be expressed as pairs of coordinates or
   as a list of 2 coordinates, according to the notation used for the input
   seeds. Note that a region is a convex polygon and its vertices are always
   listed in counter-clockwise (CCW) order.
"neighbors" is a list of 'indices' (integers), one for each edge of the
   polygon described by the above "vertices" entry. the j-th 'neighbor' is the
   "seed-idx" of the region beyond the j-th edge (or -1 if there's no region
   beyond that edge (this also means that the edge is a boundary edge of the
   whole diagram)).
e.g.
   given
    "vertices"  {x0 y0  x1 y1  x2 y2 ...  xN yN}
    "neighbors" { 5      -1          ...    3  }
   then
    the neighbor beyond the first edge  (x0 y0 x1 y1) is the seed 5
    the neighbor beyond the second edge (x1 y1 x2 y2) is the seed -1 (no neigbor!)
      ...
    the neighbor beyond the last edge   (xN yN x0 y0) is the seed 3


*** THE "fix" ENTRY

Due to some floating-point approximations in the underlying core algorithm,
sometimes vertices of a region are repeated, producing a double 'edge-loop'
e.g:
  instead of {P0 P1...} we got {P0 P1 ... P0' P1'...}.
  where P0' is 'quite the same' as P0  (error<1e-6)
  and so P1, P2 , ....

This is a rare occurrence, but sometimes it happens!
As far as I experienced, this happens only when
  the number of computed regions is 2
  AND
  a clip-polygon is used (instead of a simple clip-box).

The above 2 conditions are not a rule; sometimes a very small variation
of the input points, may cause this bug, and sometimes another small variation
may produce correct results.

As a thumb of rule, a simple *check and attempt to fix* is applied only in
these cases, being expensive to apply when the number of regions is large.
When this check is applied and an edge-loop is detected, the loop is corrected
and, as a remark for debugging, a "fix" entry with value "true" is added to the
dictionary of the region.


** DRAWING the Voronoi map in a (Tk) canvas:

Here is a simple way to draw and fill the computed geometries.

        Given
         $cvs   a canvas widgets
         $seeds a list of input coord pairs, e.g.  {x0 y0 x1 y1 .... }

        set colors {red blue}
         # -- compute the regions around the seeds -------
        set regions [Voronoi  $seeds]
         # -----------------------------------------------
        foreach region $regions {
                set vertices [dict get $region "vertices"]

                 # a simple rule for colors:
                 # regions whose seed is has an even index are "red", others are "blue"
                set idx [dict get $region "seed-idx"]
                set color [lindex $colors [expr {$idx%2}]]

                $cvs create polygon $vertices -fill $color -outline black
}These Voronoi diagrams are computed using the jc_voronoi C library from https://github.com/JCash/voronoi . It's fast and very simple to use, but the underlying floating-point arithmetic is not very robust, so you could find approximated vertices and edges. I can recommend it just for simple graphics.
I'm still looking for a more robust (and simple) C/C++ library ...
Harm Olthof 22-jan-2022: Thanks for providing this library. Did you look at GEOS ? It has a LGPL license, though. There is also CGAL Depending on the package GPL or LGPL.