JM Nov-16-2011 Some links to jcw's technical weblog, Tcl related in a very interesting way...
an inspiring site, to learn, to experiment, to share...
https://github.com/jcw/jeemon
Main Link: http://jeelabs.org
| Inside JeeMon | 2009/04/14 | <link> |
| Sensor data coming in | 2009/08/25 | <link> |
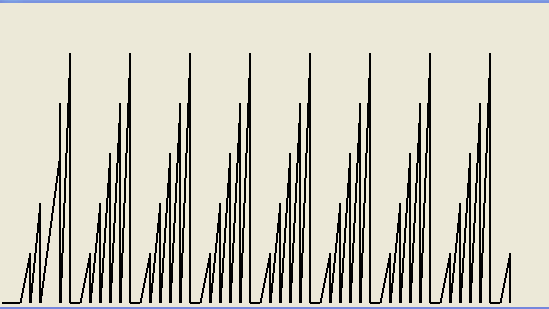
| An OOK Scope | 2010/04/13 | <link> |
| Improved OOK Scope | 2010/04/17 | <link> |
| Oven temperature plot | 2010/05/14 | <link> |
Mid 2011: JeeMon evolved to version 1.5
| Playing with indentation | 2011/09/09 | <link> |
| RFM12B Command Calculator | 2011/09/18 | <link> |
| Hacking around in software | 2011/09/24 | <link> |
| JeeMon? JeeBus? JeeRev? | 2011/11/22 | <link> |
| What’s in the yellow box? | 2011/11/23 | <link> |
| JeeRev sits under the hood | 2011/11/24 | <link> |
| JeeMon for early birds | 2011/11/25 | <link> |
Playing with JeeMon
As I don't have any hardware to collect data, I had to replace the following part on /examples/graph-demo/main.tcl, in order to get the flot chart displayed:
Instead of this:
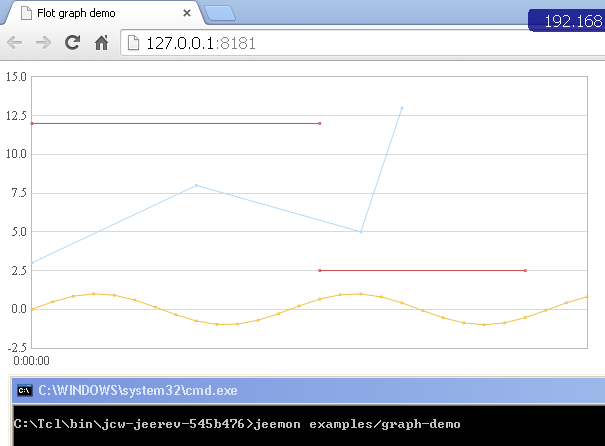
 variable js {
  var options = {
    lines: { show: true },
    points: { show: true },
    xaxis: { mode: "time" },
    legend: { position: "nw", margin: 3 },
    shadowSize: 0,
    grid: { borderWidth: 1, borderColor: "#bbbbbb" },
    series: {
      lines: { lineWidth: 1 },
      points: { radius: 0.5 },
    }
  };
  $.getJSON('data.json', function(data) {
    $.plot($("#placeholder"), data, options);
  });
 }
I used this:
 variable js {
  var options = {
    lines: { show: true },
    points: { show: true },
    xaxis: { mode: "time" },
    legend: { position: "nw", margin: 3 },
    shadowSize: 0,
    grid: { borderWidth: 1, borderColor: "#bbbbbb" },
    series: {
      lines: { lineWidth: 1 },
      points: { radius: 0.5 },
    }
  };

  $(function () {
    var d1 = [];
    for (var i = 0; i < 14; i += 0.5)
        d1.push([i, Math.sin(i)]);

    var d2 = [[0, 3], [4, 8], [8, 5], [9, 13]];

    // a null signifies separate line segments
    var d3 = [[0, 12], [7, 12], null, [7, 2.5], [12, 2.5]];

    $.plot($("#placeholder"), [ d1, d2, d3 ],options);
  });

 }
JeeMon and Arduino, a minimum example
This code is a light version of:
- An OOK Scope
- Oven temperature plot
(link above)
Arduino Code:
...place holder
main.tcl:
 Jm doc "JeeMon and Arduino - a minimum example"
 package require Tk

 proc APP.READY {} {
  # Called once during application startup.

  wm title . "Select device"

  ttk::treeview .all -columns {1 2} -show headings
  .all heading 1 -text "USB ID"
  .all heading 2 -text "Device"
  .all column 1 -width 130 -stretch 0
  .all column 2 -width 250
  set count 0
  foreach {id dev} [lsort -stride 2 [SysDep listSerialPorts]] {
    puts "$id,$dev"
    .all insert {} end -values [list $id $dev]
    incr count
  }
  pack .all -expand 1 -fill both
  bind .all <<TreeviewSelect>> [namespace which OokScope]

  if {$count == 0} {
    wm withdraw .
    tk_messageBox -type ok -message "No FTDI devices found."
    exit
  }
  update
  after 2000
  # nothing to choose, save right away
  if {$count == 1} {
    .all selection set [.all identify item 1 1]
  }
 }

 proc OokScope {} {
  set item [lindex [.all selection] 0]
  if {$item ne ""} {
    set devname [lindex [.all item $item -values] 0]
    wm withdraw .
    puts "connected to: $devname"
    set conn [Interfaces serial connect $devname 9600]

    oo::objdefine $conn {
      # override connection to collect and display a histogram

      method setup {} {

        variable start [clock seconds] lastx 0 lasty 300

        # create the GUI window
        set w .ookScope
        toplevel $w
        canvas $w.c -width 600 -height 300
        pack $w.c
      }

      method OnReadable {} {
      variable start
      variable lastx
      variable lasty
        # called whenever data is available to process the individual raw bytes
        my variable fd w count minWidth maxWidth inbuf minPulses maxPulses series
        foreach val [split [read $fd] "\n"] {
          puts $val
            set x [expr {([clock seconds]-$start) * 10}]
            if {$val == ""} {set val 0}
            set y [expr {300 - ($val*50)}]
            .ookScope.c create line $lastx $lasty $x $y -width 2
            set lastx $x
            set lasty $y
        }
      }
    }
    $conn setup
  }
 }