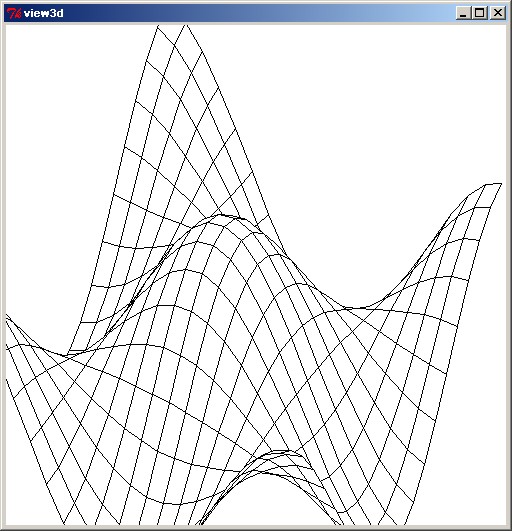
Viewer for functions of two variables
Arjen Markus (20 May 2003) This is just another one of those little applications that may come in handy sometimes. Though it is not as flexible as it probably should be - no facilities for entering the expression in a GUI, no adjustment of the scaling nor of the viewpoint - still it can be a useful tool or the starting point of one.
Suggestions welcome.
Marco Maggi Interesting. Will this always work? I mean: hidden lines will be hidden correctly for all the functions?
AM It relies on the so-called "painter's algorithm" - draw the objects in the back first and work your way forwards. This is somewhat hidden in the proc drawFunction (hence the use of the vectors for calculating the corners of the rectangles) and the range of the viewpoint coordinates. Part of the work to make it more general is to decide what the two vectors should be ... But apart from that: yes, the algorithm is robust (and cheap)
The code below contains several examples of functions that can be viewed.
 # view3d.tcl --
 #    Simple 3D viewer for functions of two independent variables
 #

 package require Tk

 # project2d --
 #    Project points in 3D space onto a 2D canvas
 # Arguments:
 #    xyzcrd    List of coordinate triplets
 # Result:
 #    List of xy-coordinates on the canvas
 # Note:
 #    Requires previous definition of viewpoint
 #
 proc project2d {xyzcrd} {
    variable project_params

    foreach {x1 y1 z1 x2 y2 z2} $project_params {break}
    foreach {x y z} $xyzcrd {
       set xc [expr {220.0+$x*$x1+$y*$y1+$z*$z1}]
       set yc [expr {320.0-($x*$x2+$y*$y2+$z*$z2)}]
       lappend result $xc $yc
    }
    return $result
 }

 # setViewpoint --
 #    Define the viewpoint
 # Arguments:
 #    xv     X-coordinate of viewpoint
 #    yv     Y-coordinate of viewpoint
 #    zv     Z-coordinate of viewpoint
 # Result:
 #    None
 # Side effect:
 #    Variable project_params filled
 #
 proc setViewpoint {xv yv zv} {
    variable project_params

    set x1 $yv
    set y1 [expr {-$xv}]
    set z1 0.0
    set x2 [expr {$xv*$zv}]
    set y2 [expr {$yv*$zv}]
    set z2 [expr {$xv*$xv+$yv*$yv}]

    set r  [expr {sqrt($x1*$x1+$y1*$y1+$z1*$z1)/200.0}]
    set x1 [expr {$x1/$r}]
    set y1 [expr {$y1/$r}]
    set z1 [expr {$z1/$r}]
    set r  [expr {sqrt($x2*$x2+$y2*$y2+$z2*$z2)/200.0}]
    set x2 [expr {$x2/$r}]
    set y2 [expr {$y2/$r}]
    set z2 [expr {$z2/$r}]

    set project_params [list $x1 $y1 $z1 $x2 $y2 $z2]
 }

 # drawFunction --
 #    Draw the function using a range of -1,1 for both x and y
 # Arguments:
 #    func     Expression taking x and y as arguments
 # Result:
 #    None
 # Note:
 #    Assumes a viewpoint from the right angle (i.e. xv < 0)
 #
 proc drawFunction {func} {

    set nostps 20
    set x10 -1.0
    set y10  0.0
    set dx1 [expr {2.0/$nostps}]
    set dy1  0.0
    set x20  0.0
    set y20 -1.0
    set dx2  0.0
    set dy2 [expr {2.0/$nostps}]

    for {set j 0} {$j < $nostps} {incr j} {
       for {set i 0} {$i < $nostps} {incr i} {
          set x1 [expr {$x10+$dx1*$i+$x20+$dx2*$j}]
          set y1 [expr {$y10+$dy1*$i+$y20+$dy2*$j}]
          set x2 [expr {$x1+$dx1}]
          set y2 [expr {$y1+$dy1}]
          set x3 [expr {$x2+$dx2}]
          set y3 [expr {$y2+$dy2}]
          set x4 [expr {$x3-$dx1}]
          set y4 [expr {$y3-$dy1}]

          set x $x1; set y $y1; set z1 [expr $func]
          set x $x2; set y $y2; set z2 [expr $func]
          set x $x3; set y $y3; set z3 [expr $func]
          set x $x4; set y $y4; set z4 [expr $func]

          set crds [project2d [list $x1 $y1 $z1 \
                                    $x2 $y2 $z2 \
                                    $x3 $y3 $z3 \
                                    $x4 $y4 $z4 ] ]
          .c create polygon $crds -fill white -outline black
       }
    }
 }

 # main --
 #    Main code:
 #    - Create the canvas
 #    - Set a viewpoint
 #    - Draw some function
 #

 canvas .c -background white -width 500 -height 500
 pack   .c -fill both

 set count 0

 proc draw {} {
    global count
    set zp [expr {3.0+2.0*sin(0.02*$count)}]
    incr count
    setViewpoint -3.0 -2.0 $zp
    .c delete all
    #drawFunction {(0.7-($x*$x+$y*$y))*(0.7-($x*$x+$y*$y))}
    #drawFunction {$x*(0.5-$x)*(0.5-($y*$y))}
    drawFunction {cos(3.0*$x)*cos(3.0*$y)}

    after 10 draw
 }

 after 0 draw
Marco Maggi I hope that AM won't mind if I steal all the fun with the script below... =) I've added some bits. I've removed the animation because my old computer was making a nuisance of itself.
AM is slightly jealous :)
There's still work to do: the graph is not centered in the canvas, this is because I was not able to do reverse engineering on the code in [setViewpoint]: AM what are you doing here? I thought that in the general case we have to use homogeneous coordinates and consider similarities between triangles...
AM Actually in [setViewpoint] I am doing much the same as you are doing in the procs to set up the transformation matrices, only a bit more hidden and I use the distance instead of three independent scaling factors ... I find that to be a more intuitive concept - just increase the distance to get an overview (instead of changing three numbers at the same time). Perhaps use the angles and the distance to set the viewpoint?
Also the zoom function is disabled: how to zoom a canvas?
I think that it would be useful to draw also walls (portions of planes) to delimit the interested ranges of coordinates and maybe add some text tag.
AM Yes, that would be a welcome addition
Maybe someone can suggest a procedure to compute a colored gradient to draw the graph levels.
Suggestions about speed optimisation are welcome.
AM I noticed that you use arrays, rather than lists - access to elements in a list is faster. Also, combining the two transformations into one single step might help.
I wonder what would be required to fly through the dunes of a function...
# plot3d.tcl --
package require Tk
proc log { string } {
#puts stderr $string
}
#PAGE
# main --
#
# Main procedure. Initialises the data structures and draw
# the initial plot.
#
# Arguments:
#
# argc - the number of arguments in argv
# argv - the command line arguments
#
# Results:
#
# Returns the empty string.
#
# Error codes:
#
# None.
#
# Side effects:
#
# None.
#
proc main { argc argv } {
global forever display data config gui_state
# xmin - the "left" bound of the x coordinate
# xmax - the "right" bound of the x coordinate
# ymin - the "left" bound of the y coordinate
# ymax - the "right" bound of the y coordinate
# xsteps - the number of lines to draw for the x coord
# ysteps - the number of lines to draw for the y coord
array set data {
XVALUES {} YVALUES {}
}
array set display {
PROJECT_MATRIX {} NORMALISE_MATRIX {}
}
array set config {
LONGITUDE 30 LATITUDE 45
XNORM 1.0 YNORM 1.0 ZNORM 1.0
XMIN -1.0 XMAX 1.0
YMIN -1.0 YMAX 1.0
XSTEPS 20 YSTEPS 20
COLOR gray
FUNCTION {cos(3.0*$x)*cos(3.0*$y)}
}
array set gui_state [array get config]
gui
wm deiconify .
tkwait visibility .
update idletasks
set config(CANVAS) $gui_state(CANVAS)
compute_projection_matrix config display
sample config data
compute_normalisation_matrix config display
plot config display data
vwait forever
exit 0
}
#PAGE
# gui --
#
# Builds the GUI. The state of the values is stored in the
# global array "gui_state": its members are the same as the
# ones in the global array "config".
#
# Arguments:
#
# None.
#
# Results:
#
# Returns the empty string.
#
# Error codes:
#
# None.
#
# Side effects:
#
# None.
#
proc gui {} {
global gui_state
wm withdraw .
wm title . "Plot 3D"
wm geometry . +30+30
option add *borderWidth 1
option add *canvas.background white
option add *canvas.width 200m
option add *canvas.height 150m
option add *canvas.borderWidth 2
option add *canvas.relief sunken
option add *exit.text "Exit"
option add *draw.text "Draw"
option add *Spinbox.from -10.0
option add *Spinbox.to 10.0
option add *Spinbox.increment 0.1
option add *Spinbox.width 6
option add *Spinbox.background white
option add *Spinbox.justify right
option add *color.justify left
option add *Labelframe.relief groove
option add *Labelframe.borderWidth 2
option add *viewpoint.text "Viewpoint"
option add *xrange.text "X Range"
option add *yrange.text "Y Range"
option add *steps.text "Steps"
option add *display.text "Display"
option add *funclab.text "Expression:"
option add *lonlab.text "Long:"
option add *latlab.text "Lat:"
option add *xlab.text "X:"
option add *ylab.text "Y:"
option add *minlab.text "Min:"
option add *maxlab.text "Max:"
option add *xnormlab.text "X scale:"
option add *ynormlab.text "Y scale:"
option add *znormlab.text "Z scale:"
option add *collab.text "Color:"
option add *sclab.text "Zoom:"
option add *Label.anchor w
option add *Label.justify left
option add *Entry.background white
option add *Entry.relief sunken
option add *Entry.borderWidth 1
# Left and right frames.
frame [set l .left]
frame [set r .right]
grid $l $r
grid rowconfigure . 0 -weight 1
grid columnconfigure . 0 -weight 1
# Canvas.
set c $l.canvas
canvas $c
grid $c -sticky news -padx 5 -pady 5
set ::gui_state(CANVAS) $c
# Function entry.
set f $l.func
frame $f
label $f.funclab
entry $f.entry -textvariable ::gui_state(FUNCTION)
grid $f.funclab -row 0 -column 0
grid $f.entry -row 0 -column 1 -sticky news
grid columnconfigure $f 0 -weight 0
grid columnconfigure $f 1 -weight 1
grid $f -sticky news -padx 5
unset f
# View point.
set f $r.viewpoint
labelframe $f
label $f.lonlab
label $f.latlab
spinbox $f.longitude -textvariable ::gui_state(LONGITUDE) \
-from 0 -to 359 -increment 1
spinbox $f.latitude -textvariable ::gui_state(LATITUDE) \
-from 0 -to 359 -increment 1
grid $f.lonlab $f.longitude -sticky news
grid $f.latlab $f.latitude -sticky news
grid $f -row 0 -column 0 -sticky news -padx 5
unset f
# X range.
set f $r.xrange
labelframe $f
label $f.minlab; label $f.maxlab
spinbox $f.xmin -textvariable ::gui_state(XMIN)
spinbox $f.xmax -textvariable ::gui_state(XMAX)
grid $f.minlab $f.xmin -sticky news
grid $f.maxlab $f.xmax -sticky news
grid $f -row 1 -column 0 -sticky news -padx 5
unset f
# Y range.
set f $r.yrange
labelframe $f
label $f.minlab; label $f.maxlab
spinbox $f.ymin -textvariable ::gui_state(YMIN)
spinbox $f.ymax -textvariable ::gui_state(YMAX)
grid $f.minlab $f.ymin -sticky news
grid $f.maxlab $f.ymax -sticky news
grid $f -row 2 -column 0 -sticky news -padx 5
unset f
# Steps.
set f $r.steps
labelframe $f
label $f.xlab
label $f.ylab
spinbox $f.xsteps -from 10 -to 100 -increment 1 \
-textvariable ::gui_state(XSTEPS)
spinbox $f.ysteps -from 10 -to 100 -increment 1 \
-textvariable ::gui_state(YSTEPS)
grid $f.xlab $f.xsteps -sticky news
grid $f.ylab $f.ysteps -sticky news
grid $f -row 3 -column 0 -sticky news -padx 5
unset f
# Display.
set f $r.display
labelframe $f
label $f.sclab
label $f.xnormlab
label $f.ynormlab
label $f.znormlab
label $f.collab
spinbox $f.scale -from -100 -to 100 -increment 1 \
-textvariable ::gui_state(SCALE) -state disabled
spinbox $f.xnorm -textvariable ::gui_state(XNORM)
spinbox $f.ynorm -textvariable ::gui_state(YNORM)
spinbox $f.znorm -textvariable ::gui_state(ZNORM)
spinbox $f.color -textvariable ::gui_state(COLOR) \
-values { gray white green }
grid $f.sclab $f.scale -sticky news
grid $f.xnormlab $f.xnorm -sticky news
grid $f.ynormlab $f.ynorm -sticky news
grid $f.znormlab $f.znorm -sticky news
grid $f.collab $f.color -sticky news
grid $f -row 4 -column 0 -sticky news -padx 5
unset f
# Button bar.
set f $r.bbar
frame $f
button $f.exit -command { quit }
button $f.draw -command { redraw }
bind $f.exit <Return> "$f.exit invoke"
bind $f.draw <Return> "$f.draw invoke"
focus $f.exit
grid $f.exit $f.draw
grid $f -row 5 -column 0 -sticky news -padx 5 -pady 5
unset f
return
}
#PAGE
# redraw --
#
# Redraws the plot. This procedure is bound to the "Draw"
# button widget.
#
# Arguments:
#
# None.
#
# Results:
#
# Checks if the plotting needs a refresh in both the samples
# and the view or only in the view; recomputes what's needed
# and updates the plot.
#
# Returns the empty string.
#
# Error codes:
#
# None.
#
# Side effects:
#
# None.
#
proc redraw {} {
upvar ::config config ::gui_state gui_state \
::data data ::display display
set update_view 0
set update_samples 0
foreach { min max } { XMIN XMAX YMIN YMAX } {
if { $gui_state($min) > $gui_state($max) } {
log "reversing $min,$max"
set a $gui_state($min)
set gui_state($min) $gui_state($max)
set gui_state($max) $a
}
}
foreach k { FUNCTION XSTEPS YSTEPS XMIN XMAX YMIN YMAX } {
if { $gui_state($k) != $config($k) } {
set update_samples 1
set update_view 1
break
}
}
if { ! $update_samples } {
foreach k { LONGITUDE LATITUDE XNORM YNORM ZNORM } {
if { $gui_state($k) != $config($k) } {
set update_view 1
break
}
}
}
array set config [array get gui_state]
if { $update_view } {
compute_projection_matrix config display
compute_normalisation_matrix config display
}
if { $update_samples } {
sample config data
compute_normalisation_matrix config display
}
plot config display data
return
}
#PAGE
# sample --
#
# Computes function's samples and stores values in an uplevel
# array.
#
# Arguments:
#
# configvar - the name of an uplevel variable holding
# current configuration from the GUI
# datavar - output variable: the name of an empty
# array that will hold the coordinates
#
# Results:
#
# Fills the "datavar" array with points coordinates.
#
# The keys are of the format "%d:%d": the first "%d" is the
# x coordinate index of a point and its range is [0...$xsteps-1];
# the second "%d" is the y coordinate index of a point and its
# range is [0...$ysteps-1].
#
# The values are coordinates triplets in a list: x, y, z.
#
# Returns the empty string.
#
# Error codes:
#
# None.
#
# Side effects:
#
# None.
#
proc sample { configvar datavar } {
upvar $configvar config $datavar data
log sampling
set dx [expr {($config(XMAX)-$config(XMIN))/$config(XSTEPS)}]
set dy [expr {($config(YMAX)-$config(YMIN))/$config(YSTEPS)}]
set data(XVALUES) [list [set x $config(XMIN)]]
for {set i 0} {$i < $config(XSTEPS)} {incr i} {
lappend data(XVALUES) [set x [expr {$x+$dx}]]
}
set data(YVALUES) [list [set y $config(YMIN)]]
for {set i 0} {$i < $config(YSTEPS)} {incr i} {
lappend data(YVALUES) [set y [expr {$y+$dy}]]
}
set zlst [list]
for {set i 0} {$i < $config(XSTEPS)} {incr i} {
for {set j 0} {$j < $config(YSTEPS)} {incr j} {
set data($i:$j) [list \
[set x [lindex $data(XVALUES) $i]] \
[set y [lindex $data(YVALUES) $j]] \
[set z [::function $config(FUNCTION) $x $y]]]
lappend zlst $z
}
}
set zlst [lsort -increasing -real $zlst]
set config(ZMIN) [lindex $zlst 0]
set config(ZMAX) [lindex $zlst end]
return
}
#PAGE
# compute_projection_matrix --
#
# Defines the point of view from which we see the world.
# The direction of view is always from the point of view
# to the center of the plot, computed as mean value of
# the x and y ranges and normalised to (-1,1) intervals.
#
# Arguments:
#
# configvar - the name of an uplevel variable holding
# current configuration from the GUI
# displayvar - the name of an uplevel variable holding
# current configuration of the display
#
# Results:
#
# Returns the empty string.
#
# Error codes:
#
# None.
#
# Side effects:
#
# None.
#
proc compute_projection_matrix { configvar displayvar } {
upvar $configvar config $displayvar display
log "update viewpoint"
set lon [expr {$config(LONGITUDE)/360.0*6.28318530718}]
set lat [expr {$config(LATITUDE)/360.0*6.28318530718}]
set xv [expr {cos($lon)*cos($lat)}]
set yv [expr {sin($lon)*cos($lat)}]
set zv [expr {sin($lat)}]
set xv [expr {-$xv}]
set yv [expr {-$yv}]
# - - - -
# | x1 y1 z1 | | yv -xv 0.0 |
# | |=| |
# | x2 y2 z2 | | (xv*zv) (yv*yv) (xv*xv+yv*yv)|
# - - - -
set x1 $yv
set y1 [expr {-$xv}]
set z1 0.0
set x2 [expr {$xv*$zv}]
set y2 [expr {$yv*$zv}]
set z2 [expr {$xv*$xv+$yv*$yv}]
# Here the rows are normalised to become unit vectors.
set r [expr {sqrt($x1*$x1+$y1*$y1+$z1*$z1)}]
set x1 [expr {$x1/$r}]
set y1 [expr {$y1/$r}]
set z1 [expr {$z1/$r}]
set r [expr {sqrt($x2*$x2+$y2*$y2+$z2*$z2)}]
set x2 [expr {$x2/$r}]
set y2 [expr {$y2/$r}]
set z2 [expr {$z2/$r}]
set display(PROJECT_MATRIX) [list $x1 $y1 $z1 $x2 $y2 $z2]
}
#PAGE
# compute_normalisation_matrix --
#
# The normalisation matrix maps coordinates in the (min, max)
# ranges into coordinates in the (-1.0, +1.0) range.
#
# Arguments:
#
# configvar - the name of an uplevel variable holding
# current configuration from the GUI
# displayvar - the name of an uplevel variable holding
# current configuration of the display
#
# Results:
#
# Returns the empty string.
#
# Error codes:
#
# None.
#
# Side effects:
#
# None.
#
proc compute_normalisation_matrix { configvar displayvar } {
upvar $configvar config $displayvar display
log "update normalisation"
set NX [expr {$config(XNORM)*2.0}]
set NY [expr {$config(YNORM)*2.0}]
set NZ [expr {$config(ZNORM)*2.0}]
set x0 [expr {($config(XMAX)+$config(XMIN))/2.0}]
set y0 [expr {($config(YMAX)+$config(YMIN))/2.0}]
set z0 [expr {($config(ZMAX)+$config(ZMIN))/2.0}]
set x11 [expr {180.0*$NX/($config(XMAX)-$config(XMIN))}]
set y22 [expr {180.0*$NY/($config(YMAX)-$config(YMIN))}]
set z33 [expr {180.0*$NZ/($config(ZMAX)-$config(ZMIN))}]
set display(NORMALISE_MATRIX) [list $x11 $y22 $z33 $x0 $y0 $z0]
return
}
#PAGE
# project2d --
#
# Projects points in 3D space onto a 2D canvas.
#
# Arguments:
#
# displayvar - the name of the uplevel variable holding
# the display data
# xyzcrd - List of coordinate triplets
#
# Results:
#
# List of xy-coordinates on the canvas
#
# Error codes:
#
# None.
#
# Notes:
#
# Requires previous definition of viewpoint.
#
proc project2d { displayvar xyzcrd } {
upvar $displayvar display
foreach {x1 y1 z1 x2 y2 z2} $display(PROJECT_MATRIX) {}
# - - - - - - - -
# | xc | | x1 y1 z1 || x | | x0 |
# | | = | || |+| |
# | yc | | x2 y2 z2 || y | | y0 |
# - - - - | | - -
# | z |
# - -
# x0 and y0 should be half the size of the canvas to center
# the image (more or less)
set xlst [list]
set ylst [list]
foreach {x y z} $xyzcrd {
set xc [expr {(550.0/2)+($x*$x1+$y*$y1+$z*$z1)}]
set yc [expr {(400.0/2)-($x*$x2+$y*$y2+$z*$z2)}]
lappend result $xc $yc
lappend xlst $xc
lappend ylst $yc
}
set display(XMIN2D) [lindex $xlst 0]
set display(XMAX2D) [lindex $xlst end]
set display(YMIN2D) [lindex $xlst 0]
set display(YMAX2D) [lindex $xlst end]
return $result
}
#PAGE
# normalise3d --
#
# Normalises a triplet of coordinates using the normalisation
# matrix. This maps a coordinate triplet from the (min, max)
# ranges into the (norm_min, norm_max) ranges.
#
# Arguments:
#
# displayvar - the name of the uplevel variable holding
# the display data
# xyzcrd - list of coordinate triplets
#
# Results:
#
# Returns the list of normalised coordinates.
#
# Error codes:
#
# None.
#
# Side effects:
#
# None.
#
proc normalise3d { displayvar xyzcrd } {
upvar $displayvar display
foreach { x11 y22 z33 x0 y0 z0 } $display(NORMALISE_MATRIX) {}
# - - - - - - - -
# | x | | x11 || x | | x0 |
# | | | || | | |
# | y |=| y22 || y |-| y0 |
# | | | || | | |
# | z | | z33 || z | | z0 |
# - - - - - - - -
set result [list]
foreach {x y z} $xyzcrd {
set x [expr {$x*$x11-$x0}]
set y [expr {$y*$y22-$y0}]
set z [expr {$z*$z33-$z0}]
lappend result $x $y $z
}
return $result
}
#PAGE
# plot --
#
# Draws the function the selected ranges and steps.
#
# Arguments:
#
# configvar - the name of an uplevel variable holding
# current configuration from the GUI
# displayvar - the name of an uplevel variable holding
# current configuration of the display
# datavar - the name of the uplevel array holding the
# function samples as described in [sample]
#
# Results:
#
# Returns the empty string.
#
# Error codes:
#
# None.
#
# Side effects:
#
# Assumes a viewpoint from the right angle (i.e. xv < 0)
#
proc plot { configvar displayvar datavar } {
upvar $configvar config $displayvar display $datavar data
log plotting
set xsteps $config(XSTEPS)
set ysteps $config(YSTEPS)
set canvas $config(CANVAS)
$canvas delete all
switch $config(COLOR) {
white - green {
set color $config(COLOR)
set grayscale 0
}
gray {
set grayscale 1
}
}
incr xsteps -1
incr ysteps -1
for {set i 0} {$i < $xsteps} {incr i} {
for {set j 0} {$j < $ysteps} {incr j} {
# x1,y1 x1,y2
# o----------o--------> Y
# | |
# | |
# | |
# | |
# x2,y1 o----------o
# | x2,y2
# |
# v
# X
#
# [<canvas> create polygon] wants a polygon =), so the
# sequence must be: (x1,y1), (x1,y2), (x2,y2), (x2,y1)
set i1 [expr {$i+1}]
set j1 [expr {$j+1}]
foreach {x1 y1 z1} $data($i:$j) \
{x2 y2 z2} $data($i:$j1) \
{x3 y3 z3} $data($i1:$j1) \
{x4 y4 z4} $data($i1:$j) \
{}
if { $grayscale } {
# Compute the average of the four z coordinates; compute
# its "position" in the z (min, max) range and map this
# into the (50, 200) gray level.
#
# We limit the gray range to (100, 230) because outside
# it gets too dark and too bright.
set gray [expr {int(floor(((($z1+$z2+$z3+$z4)/4)-$config(ZMIN))/($config(ZMAX)-$config(ZMIN))*130+100))}]
set color [format "#%x%x%x" $gray $gray $gray]
}
$canvas create polygon [project2d display \
[normalise3d display [list \
$x1 $y1 $z1 \
$x2 $y2 $z2 \
$x3 $y3 $z3 \
$x4 $y4 $z4 \
]]] -fill $color -outline black
}
}
return
}
#PAGE
# function --
#
# The function to be drawn.
#
# Arguments:
#
# x - the x coordinate
# y - the y coordinate
#
# Results:
#
# Returns the empty string.
#
# Error codes:
#
# None.
#
# Side effects:
#
# None.
#
proc function { func x y } {
eval expr $func
}
#PAGE
# quit --
#
# Exits the script.
#
# Arguments:
#
# None.
#
# Results:
#
# Returns the empty string.
#
# Error codes:
#
# None.
#
# Side effects:
#
# None.
#
proc quit {} {
set ::forever 1
}
#PAGE
## ------------------------------------------------------------
## Main script.
## ------------------------------------------------------------
main $argc $argv
### end of file
# Local Variables:
# mode: tcl
# page-delimiter: "^#PAGE"
# End: