A 3D Generator-and-Examiner for Parametric Surfaces of 2 Variables
uniquename - 2013jan02
On the page Enhanced 3D Plot Examiner for functions of 2 variables, I presented code for a Tk GUI that allows for examining surfaces generated over a rectangular grid in the x-y plane --- by determining z from a function f(x,y).
That was nice. In that script, I established a lot of procs that I can use for other 3D viewers. But the 'generator' part of that script only generates 'single-valued' functions over a rectangular domain.
It is not suited to drawing-and-viewing spheres, ellipsoids, toruses, cylinders, and other such surfaces that wrap around on themselves. These are surfaces that are not 'single-valued' over a set of points in a plane, and they do not 'cover' a rectangular domain in our 'world coordinates' 3D space.
However, these kinds of surfaces can be generated by 'parametric' functions of the form x=f(u,v), y=g(u,v), z=h(u,v) where u and v can be allowed to vary over a rectangular domain.
So I set about to modify the generator-and-examiner script for surfaces given by z=f(x,y) so that it could generate and examine parametric surfaces of the kind x=f(u,v), y=g(u,v), z=h(u,v).
I decided to stick with generating quadrilaterals (rather than triangles) --- over the u,v domain now, instead of the x,y domain. That would make it somewhat easier to re-use some of the code in generating the surface.
One of the biggest changes that I had to make is in the method of drawing the polygons --- in particular, handling the hiding of the quadrilaterals at the back of the view.
In the script for functions f(x,y) generated over a rectangle in the xy plane, I could simply start drawing from the 'far-away' corner of the rectangular grid.
In this case of a rectangular domain in u,v parameter space, however, I could not count on any corner of that rectangle having polygons at the back of the view. I needed to come up with a polygon sorting routine according to 'z-depth'.
(Actually, because of the axes I chose relative to the viewing screen, and because of the rotational transformation I chose, I sorted according to 'x-depth'.)
Devising such a polygon-sort routine was just what I needed for some future 3D projects I have in mind. For example, on my 'bio' page at uniquename, I have pointed out that I found the 3D model viewing programs of MBS = Mark Stucky (3dviewer : A canvas only viewer of 3D data) and GS = Gerard Soohaket (3D polyhedra with simple tk canvas) quite inspiring. I want to devise a similar 3D viewer --- but with enhanced 3D model import options and some other enhancements. I want to support reading and examining models from ASCII file formats such as Wavefront OBJ, Stereolithography STL, Cyberware PLY, Geomview OFF, and a CAE(FEA)-like file format.
For that project, I will need a polygon sorting routine according to 'z-depth'. So this project to make a generator-and-examiner for parametric surfaces would be a step in the right direction.
---
MY GOALS:
I decided to make a similar utility to my z=f(x,y) 3D surface generating and examining utility --- including the following features.
1) ROTATION METHOD:
I would allow the user to specify latitude and longitude angles to specify the view direction.
I would use Tk 'scale' widgets so that setting the 2 view angles can be done quickly and redraw is almost immediate. I would use button1-release bindings on the scales to cause the redraw as soon as a scale change is complete.
(I may eventually add bindings to mouse events on the canvas, like <Motion>, so that the view rotation can be done even more quickly & conveniently. This would be similar to rotate/zoom/pan controls that Mark Stucky provided in a 3D model viewer that he published at wiki.tcl.tk/15032 - 3dviewer : A canvas only viewer of 3D data)
2) FUNCTION ENTRY:
Instead of having one entry field for the function f(x,y), I would have 3 entry fields --- for functions f(u,v), g(u,v), h(u,v). And like in my f(x,y) utility, I would have a listbox of sample surfaces (by name) on the left of the GUI. Clicking on a line in the listbox puts a set of functions in the 3 entry function fields.
This provides a way of providing some interesting functions that a user can quickly try (and alter), instead of the user spending time trying to think of parametric functions to try.
By using the listbox with scrollbars, an essentially unlimited number of interesting surfaces could be supplied eventually.
3) COLOR CHOICES:
I would (again) allow color choices for the
- polygon fill
- polygon outline
- canvas background
from among 16 million colors, each.
4) DISPLAY OPTIONS:
I would (again) provide 3 radiobuttons by which polygon fill, outline (wireframe display on the canvas background color), or both (fill and outline) can be specified.
5) ZOOM OPTION:
I would (again) provide a 'zoom' Tk scale widget, by which the plot can easily be resized, down or up --- to make sure the entire plot can be seen on the canvas.
Like with the 2 scales for the longitude-latitude view angles, I would use a button1-release binding on the zoom scale to cause the redraw as soon as a scale change is complete.
6) MATH APPROACH:
I would (again) think of the 'fixed, global' coordinate axes oriented as follows:
- positive z-axis is 'up'
- positive y-axis is 'to the right'
- positive x-axis is 'out of the screen'.
Based on that, I would let the 'longitudinal' ('yaw') view angle specify a rotation around the z-axis and the 'latitudinal' ('pitch') view angle specify a rotation around the y-axis.
Then rotations of the surface could be given by an Ry * Rz rotation matrix product.
(We are avoiding 'roll' --- rotation around the x axis. It is too disorienting. 'Roll' is for fighter jet simulations and for emulating a modern cork-screw, turn-me-upside-down roller coaster ride. After all ...
When we examine an object, like a motorcycle, we walk around it and we may put our eyes somewhat above or below its middle --- but we generally do not stand on our head to examine it.)
In addition to these rotational considerations, I needed to implement a new procedure for sorting the polygons before drawing them. It appeared that I should be able to use the '-command' option of the Tcl 'lsort' command --- by providing a 'compare' proc to compare 2 given polygon IDs, according to a depth-measure.
---
In aiming to accomplish these goals, I ended up with the GUI seen in the following image.
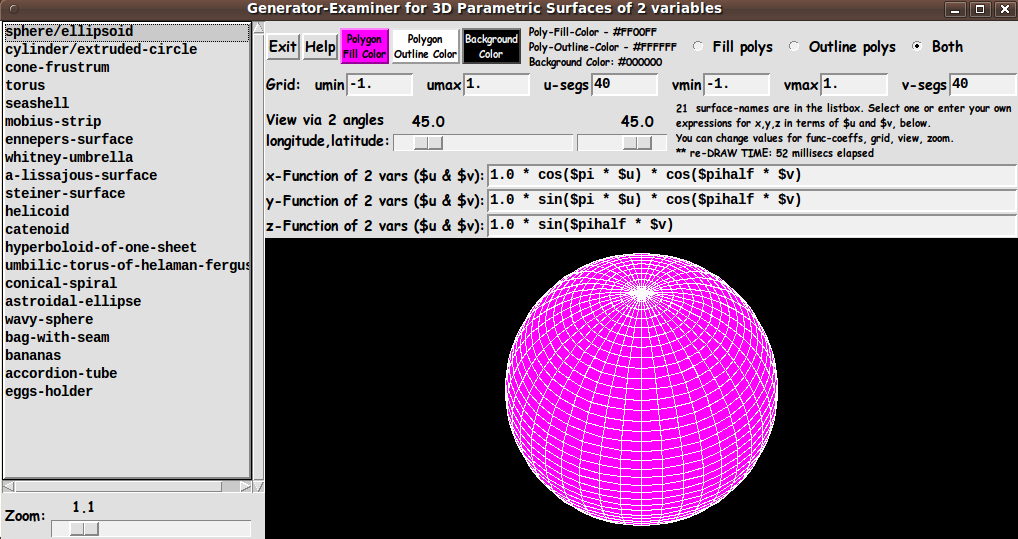
In this image, you can see the three buttons for color-setting, across the top of the GUI --- 'Fill', 'Outline', and 'Background'.
To the right of the color-setting buttons, you can see the fill/outline/both radiobuttons, which are used to basically allow for switching between a 'wireframe' display and an opaque-color display.
The next frame down contains the 'Grid' entry fields --- for umin, umax, u-segs, vmin, vmax, and v-segs.
And the next frame contains the 2 scales for the longitude and latitude rotation angles.
And below that frame are the 3 entry fields for the functions f(u,v), g(u,v), and h(u,v) --- to allow for evaluating x,y,z coordinates of points on a surface.
In addition to showing these GUI features, the image above indicates that the polygon-sort routine was doing its job quite capably.
GS had commented on his page 3D polyhedra with simple tk canvas:
"The hidden face removal algorithm works well with convex objects but is very limited for the others. See for instance the torus or the shuttle as bad examples."
That indicated to me that a torus might be a stern test of a 'painters-type' algorithm. So I was relieved that a plot of a torus, seen below, turned out quite well.
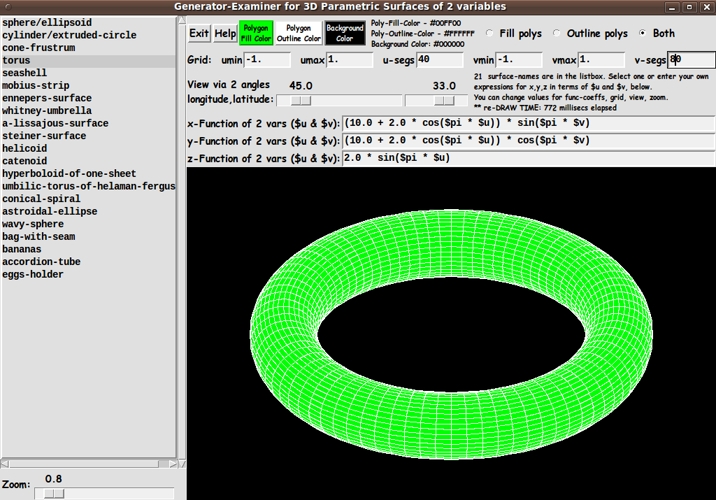
And the quality of the image held up at various view angles.
---
The 'Help' button on the GUI shows the following text. It describes the various ways in which a 'draw' is triggered.
HELP for this 3D Parametric-Surface Generation-and-Examination Utility
SELECTING/ENTERING FUNCTIONS:
When the GUI comes up, you can use the listbox to select a parametric-surface to plot, by a 'surface name'.
A MouseButton-1 (MB1) click-release on a 'surface name' will put expressions in variables $u and $v into the 3 x,y,z function entry fields. The functions will be immediately plotted in the canvas area.
Alternatively, you may enter 3 functions of $u and $v of your own choosing in the 3 'function-entry-fields'. The main rule to observe is to use '$u' and '$v' to represent u and v. And, of course, you should compose a syntactically-correct math expression that is to be evaluated at each u,v location on a rectangular grid of u,v coordinates.
'$pi', '$twopi', and '$pihalf' are defined in this utility. You can use those variable names in the expressions when you need the value of pi --- or two times pi --- or half of pi.
---
CHANGING FUNCTIONS (also called EXPRESSIONS) :
You can change coefficients in a function or change the formulation of the function, in the entry fields. To re-plot the new function(s), you can press the Enter key when all the entry fields are ready. OR, to re-plot at any time, you can MB3-click-release on any of the 'function-entry-fields'.
---
ALTERING THE GRID:
You can change the grid parameters --- umin,umax,u-segs, vmin,vmax,v-segs --- by entering new values. To re-plot based on the new grid, you can press the Enter key in any grid entry field --- or to re-plot at any time, you can MB3-click-release on any of the 'grid-entry-fields'.
Note that the min,max values of u and v can be left at -1.0 and 1.0. The coefficients of $u and $v in the 3 expressions can be adjusted, instead.
---
CHANGING THE VIEW ANGLE:
You can use the two 'angle-scale' widgets to quickly change either of a couple of rotation angles --- longitude or latitude.
An MB1-release of the slider on a angle-scale widget causes a replot.
You can simply keep clicking in the 'trough' of either scale widget (to the left or right of the scale-button) to step through a series of re-plots, varying an angle one degee per click-release.
Or you can hold MB1 down, when the mouse cursor is to the right or left of the scale-button in the trough, to rapidly but rather precisely change to a new angle of rotation. Releasing MB1 will cause a re-plot at the new angle.
---
ZOOMING:
You can use the 'zoom-scale' widget to magnify or shrink the plot.
An MB1-release of the slider on the zoom-scale widget causes a replot.
Click-release in the 'trough' --- on either side of the scale's button --- to zoom in/out a little at a time.
---
FILL/OUTLINE/BOTH:
The fill/outline/both radiobuttons allow for showing the plot with the polygons (quadrilaterals) color-filled or not --- and with outlines ('wireframe' mode) or not.
---
COLOR:
Three COLOR BUTTONS on the GUI allow for specifying a color for
  - the interior of the polygons
  - the outline of the polygons
  - the (canvas) background
from among 16 million colors, each.
---
Summary of 'EVENTS' that cause a 'REDRAW' of the plot:
Pressing Enter/Return key when focus is in one of the 3 'function-entry-fields'. Alternatively, a button3-release in a 'function-entry-field'.
Pressing Enter/Return key when focus is in the
  - 'umin' entry field
  - 'umax' entry field
  - 'u-segs' entry field
  - 'vmin' entry field
  - 'vmax' entry field
  - 'v-segs' entry field
Alternatively, a button3-release in any of the 'grid-entry-fields'.
Button1-release on the LONGITUDE or LATITUDE scale widget.
Button1-release on the ZOOM scale widget.
Button1-release on the FILL or OUTLINE or BOTH radio-buttons.
Changing color via the FILL or OUTLINE color buttons.
ALSO: Resizing the window changes the size of the canvas, which triggers a redraw of the plot according to the new canvas size.
The code
I provide the code for this 3D surface generator-and-examiner Tk script below.
I follow my usual 'canonical' structure for Tk code for this Tk script:
  0) Set general window & widget parms (win-name, win-position,
     win-color-scheme, fonts, widget-geometry-parms, win-size-control,
     text-array-for-labels-etc).

  1a) Define ALL frames (and sub-frames, if any).
  1b) Pack   ALL frames and sub-frames.

  2) Define & pack all widgets in the frames, frame by frame.
     Within each frame, define ALL the widgets. Then pack the widgets.

  3) Define keyboard and mouse/touchpad/touch-sensitive-screen action
     BINDINGS, if needed.

  4) Define PROCS, if needed.

  5) Additional GUI initialization (typically with one or more of
     the procs), if needed.
This structure is discussed in more detail on the page A Canonical Structure for Tk Code --- and variations.
This structure makes it easy for me to find code sections --- while generating and testing a Tk script, and when looking for code snippets to include in other scripts (code re-use).
I call your attention to step-zero. One new thing that I have started doing recently is using a text-array for text in labels, buttons, and other widgets in the GUI. This can make it easier for people to internationalize my scripts. I will be using a text-array like this in most of my scripts in the future.
Experimenting with the GUI
As in all my scripts that use the 'pack' geometry manager (which is all of my 100-plus scripts, so far), I provide the four main pack parameters --- '-side', '-anchor', '-fill', '-expand' --- on all of the 'pack' commands for the frames and widgets.
That helps me when I am initially testing the behavior of a GUI (the various widgets within it) as I resize the main window.
I think that I have used a nice choice of the 'pack' parameters. The labels and buttons and scales stay fixed in size and relative-location as the window is re-sized --- while the 'canvas' expands/contracts as the window is re-sized.
You can experiment with the '-side', '-anchor', '-fill', and '-expand' parameters on the 'pack' commands for the various frames and widgets --- to get the widget behavior that you want.
___
In addition, you might want to change the fonts used for the various GUI widgets. For example, you could change '-weight' from 'bold' to 'normal' --- or '-slant' from 'roman' to 'italic'. Or change font families.
In fact, you may NEED to change the font families, because the families I used may not be available on your computer --- and the default font that the 'wish' interpreter chooses may not be very pleasing.
I use variables to set geometry parameters of widgets --- parameters such as border-widths and padding. And I have included the '-relief' parameter on the definitions of frames and widgets. Feel free to experiment with those 'appearance' parameters as well.
___
Note that the color buttons call on a color-selector-GUI script to set the colors. You can make that color-selector script by cutting-and-pasting the code from the page A non-obfuscated color selector GUI on this site.
Some features in the code
That said, here's the code --- with plenty of comments to describe what most of the code-sections are doing.
You can look at the top of the PROCS section of the code to see a list of the procs used in this script, along with brief descriptions of how they are called and what they do.
___
As in my f(x,y) generator-and-examiner script, one interesting feature of this GUI is the way the procs involved in a redraw are broken up into a sequence:
  1) load_points_array
  2) translate_points_array
  3) rotate_points
  4) sort_polyIDs_list
  5) draw_2D_pixel_polys
But in this script, I have added the proc 'sort_polyIDs_list'.
Some 'events' --- such as changing the functions or the uv-grid --- trigger the execution of all 5 procs (in that order), while other events (like longitude or latitude change) trigger the execution of only the last 3 procs. And some 'simple' changes (like a color change or a switch to wireframe mode) trigger the execution of only the last proc.
Note that I do most of the calculations in 'world coordinates', NOT pixel coordinates. All the coordinate calculations in the first 3 procs are done in world coordinates.
It is in the 5th proc that I obtain a set of 2D points from a family of 3D points, and I map a 'bounding area' of the 2D points into the current canvas area, in units of pixels --- to finally get the plot, via 'create polygon' commands.
---
To implement the 'sort_polyIDs_list' proc, I needed to provide a 'compare' proc for the '-command' option of the 'lsort' command. You can see the guts of that proc --- which is named 'compare_2polyIDs_by_zdepth' --- in the code.
___
It is my hope that the copious comments in the code will help Tcl-Tk coding 'newbies' get started in making GUI's like this.
Without the comments, potential young Tcler's might be tempted to return to their iPhones and iPads and iPods --- to watch videos of kids hitting their fathers in the mid-section with balls or the less-forgiving bat.
Code for Tk script '3Dexaminer_forParametricSurfacesOf2vars_3DprojectOn2Dcanvas_RyRz.tk' :
#!/usr/bin/wish -f
##+###########################################################################
##
## SCRIPT: 3Dexaminer_forParametricSurfacesOf2vars_3DprojectOn2Dcanvas_RyRz.tk
##
## PURPOSE: This Tk script serves to GENERATE AND EXAMINE surfaces described by
## parametric equations of 2 independent variables --- u and v, say ---
## equations such as
## x = a * cos(pi * u)
## y = b * sin(pi * u)
## z = v
## --- for a cylinder (when a and b are equal) --- where u and v vary
## between -1.0 and 1.0, say. (a and b are constants for a given cylinder,
## while u and v are varied to determine the surface.)
##
## The SURFACE GENERATOR portion of this script generates
## '3D grid points' given by expressions f(u,v),g(u,v),h(u,v)
## for x,y,z --- where u and v are specified 'discretely' at
## points in a rectangular grid pattern in the square with
## opposite corners at (-1.0,-1.0) and (1.0,1.0).
##
## In other words, the user can specify the number of 'segments'
## in which to break up -1.0 to 1.0, in the u and v directions.
## Then 3D points x(i,j),y(i,j),z(i,j) are generated
## from values of u(i) and v(j) where i is between 0 and Nusegs
## and j is between 0 and Nvsegs --- and where the user has specified
## Nusegs and Nvsegs.
##
## The EXAMINER portion of this script allows the user to rotate
## (and zoom) the quadrilateral polygons into which each surface
## is segmented.
##
## (Note that in some cases, such as parameterizations of a sphere,
## some quadrilaterals 'degenerate', i.e. 'collapse', into
## trianglar polygons, but we can still treat those polygons ---
## for purposes of translation, rotation, and projection ---
## as quadrilaterals.)
##
## METHOD OF ROTATION:
##
## In this script, the points in the 'data cloud' of the segmented
## parametric surface are automatically translated so that rotations
## are performed around a point in the middle of the 'data cloud'.
##
## The 2D projection points of the 3D points x(i,j),y(i,j),z(i,j) are
## determined according to a user-specified view direction, specified
## via longitude ('yaw') & latitude ('pitch') angles. In other words,
## the rotation of the surface is determined by those 2 angles.
##
## A bounding box of the translated-rotated 3D points is determined and
## the 2D projection points are then 'mapped' onto a rectangular Tk canvas.
##
## The '3D plot' onto the canvas is achieved by plotting 4-sided polygons
## made from the 2D projection points of the corners of the quadrilateral
## (not necessarily planar) polygons in 3-space.
##
## The script provides a GUI on which there is are 3 entry fields
## into which the user can enter Tcl mathematical expressions in
## variables specified as '$u' and '$v'. Example:
##
## for x: 1.0 * cos($pi * $u) * cos($pihalf * $v)
## for y: 1.0 * sin($pi * $u) * cos($pihalf * $v)
## for z: 1.0 * sin($pihalf * $v)
##
## for a unit sphere --- where u and v vary between -1.0 and 1.0 and
## where $pi and $pihalf are 'constant variables' defined in this script.
##
## ORIENTATION OF 'FIXED, GLOBAL' X,Y,Z AXES (relative to the computer screen):
##
## We imagine the postive z-axis as 'up', the postive y-axis 'to
## the right', and the postive x-axis coming 'out of the monitor
## screen'.
##
## (We choose this particular orientation of the xyz axes, because
## a typical way of parameterizing a cylinder or sphere is where
## the circular cross-section of the cylinder is parallel to the xy
## plane and where the axis of the cylinder is parallel to the z-axis
## --- and where the north and south poles of the sphere are on the
## z-axis and the equator of the sphere is parallel to the xy plane.
##
## We would like the 'front view' (latitude zero, longitude zero)
## of such a sphere to be oriented so that the north and south poles
## are at the top and bottom of the viewport --- and so that the
## 'front view' of the cylinder just described is such that the top
## and bottom of the cylinder are at the top and bottom of the viewport.
##
## But note that we could have chosen the postive y-axis as 'up',
## the postive x-axis 'to the right', and the postive z-axis coming
## 'out of the monitor screen' --- which is often done in graphical
## programs for CAD/CAE applications.)
##
## With the 'z-is-up' choice of axes, our longitudinal/yaw and latitudinal/pitch
## angles are measured around the z and y axes, respectively.
##
## In terms of rotation matrices, we will rotate the 'cloud of points'
## of a given 'polygonized' parametric surface according to a
## rotation matrix product Ry * Rz.
##
##+###########
## INSPIRED BY:
## This script is inspired by (and sourced from) my own script for
## examining 3D surfaces made from functions of 2 variables ---
## i.e. surfaces defined by 3D points (x,y,f(x,y)) evaluated over a
## rectangular grid of points in the xy plane.
##
## I wanted to extend that script so that it could handle showing
## spheres, ellipsoids, toruses, and other surfaces that can be
## described by functions x=f(u,v), y=g(u,v), z=h(u,v).
##
## That script of mine, in turn, was inspired by a 3D plotting script
## titled 'view3d.tcl' from AM (Arjen Markus), 2003 May --- presented
## on the page 'Viewer for functions of 2 variables' at
## https://wiki.tcl-lang.org/8928.
##
## That AM-script indicated that it should be possible to use Tcl-Tk
## to do plots of 3D functions involving hundreds or thousands
## of data points, projected onto a Tk canvas as polygons,
## within a second of time, for each complete plot.
##
## On the same wiki page https://wiki.tcl-lang.org/8928 'Viewer for functions
## of 2 variables', MM (Marco Maggi) added an alternative script.
## MM (Marco Maggi) provided about a dozen GUI widgets to make a Tk script
## that is quite a bit more useful, that is, the user did not have to edit
## the Tk script to change the function, the grid, or viewing angles.
##
## In any case, I realized that plotting 3D points (x,y,f(x,y)), while
## nice for making 'single-valued' surfaces over the xy plane, did
## not allow for making 'closed' surfaces like spheres, cylinders,
## ellipsoids, toruses, etc. --- surfaces that do not 'cover' a rectangle
## (i.e. have a z-value for every x,y value in the rectangle)
## or surfaces that are not 'single-valued' for each x,y.
##
## So I decided to make a GUI that allowed for specifying a literally
## infinite number of 'parametric' surfaces --- and add to and alter some
## of the procs of my f(x,y) generate-and-examine script so that the procs
## are suitable for handling hiding polygons at the back of the view
## --- via a z-sort routine.
##
## So, like in my f(x,y) generate-and-examine script, there is a scrollable
## listbox in this GUI, by which an unlimited number of parametric
## surfaces can be specified. Selecting a line in the listbox fills in
## 3 entry fields in the GUI with functions f(u,v), g(u,v), and h(u,v).
##
## Like in my f(x,y) generate-and-examine script, this script may
## eventually have other enhancements added, such as an option to
## - shade the polygons (via polygon normals compared to a light source
## direction --- i.e. via a vector cross-product and dot-product).
##
##+############################
## SOME FEATURES OF THIS SCRIPT --- many borrowed from my f(x,y) script:
##
## I allow the user to specify latitude and longitude angles to specify
## the view direction. I use 2 Tk scales so that setting the 2 view angles
## can be done quickly and a redraw is almost immediate. I use button1-release
## bindings on the scales to cause the redraw as soon as a scale change is complete.
##
## The user can keep tapping button1 'in the trough' of either scale to step
## through rotating the surface, one degree per click.
##
## (I may eventually add bindings to mouse events on the canvas, like <Motion>,
## so that the view rotation can be done even more quickly & conveniently.
## This would be similar to rotate/zoom/pan controls that Mark Stucky provided
## in a 3D model viewer that he published at wiki.tcl.tk/15032.)
##
## In addition to having 3 entry fields for providing math expressions for x, y,
## and z coordinates of a point (given by parameters $u and $v),
## I provide a listbox of names for functions on the left of the GUI ---
## names like 'cylinder', 'sphere', 'torus'.
##
## Clicking on a line in the listbox puts 3 expressions in the 3 entry fields.
## This provides a way of providing some interesting expressions that a user can
## quickly try (and alter), instead of the user spending time trying to think of
## expressions to try.
##
## By using the listbox, an essentially unlimited number of interesting
## parametric surfaces (triplets of math expressions) could be supplied eventually.
##
## I allow color choices for the
## - canvas background
## - the polygon fill
## - the polygon outline
## from among 16 million colors, each.
##
## I provide 3 radiobuttons by which polygon fill, outline (wireframe display on
## the canvas background color), or both (fill and outline) can be specified.
##
## I MAY provide some radiobuttons/checkbuttons by which the user can specify
## how colors are to be chosen for the polygons --- by the polygon-fill button,
## OR randomly, OR via a table of colors (e.g. rainbow-like) applied according to
## z-height/y-height/x-height, and other(?).
##
## I provide a 'zoom' Tk scale widget, by which the plot/projection can easily be
## resized, down or up --- to make sure the entire plot can be seen on the canvas.
##
## Like with the 2 scales for the longitude-latitude view angles, I use a
## button1-release binding on the zoom scale to cause the redraw as soon as a
## scale change is complete.
##
## In summary, this GUI provides a wealth of options, such as a variety of color
## controls, multiple ways of triggering a quick redraw (Enter key in the
## entry widgets, button1-release on scale widgets, and other), and
## easy-quick control on putting the entire plot within the canvas (auto-mapping
## of the diameter of the model into the current canvas area and a zoom control).
##
##+###################
## MATH CONSIDERATIONS (rotation):
##
## To rotate the parametric surface,
## I use a set of formulas based on an Ry * Rz rotation matrix approach
## where Rz is a (longitudinal, 'yaw') rotation about a 'global, fixed' z-axis
## and Ry is a (latitudinal, 'pitch') rotation about a 'global, fixed' y-axis.
##
## I do most of the calculations in 'world coordinates'.
## When I have a set of 2D points from a family of 3D points (the x,y coordinates
## of the translated-rotated 3D points), I map a 'bounding area' of the
## 2D points into the current canvas area, in units of pixels ---
## to finally get the 'plot' for a given longitude and latitude.
##
##+#############################
## MATH-and-LOGIC CONSIDERATIONS (hidden polygons):
##
## In my f(x,y) script,
## I used a "painter's algorithm" (or my interpretation of it)
## to handle hiding portions of polygons that are hidden by
## polygons in the foreground. I started drawing polygons from
## the corner of the grid that is farthest away from the view point (eye).
##
## In other words, I let the xy quadrant --- over which the 'eye' lies ---
## (i.e. the quadrant of the longitudinal angle) determine the 'start corner'
## of the 'painting'.
##
## For example, if the 'eye' is over the first quadrant of the xy plane,
## the 'start corner' of 'painting' would be the xmin,ymin (far) corner of the
## 'rectangular grid' below the x,y,f(x,y) points.
##
## 2nd example: If the 'eye' lies over the 3rd quadrant of the xy plane,
## the 'start corner' of 'painting' would be the xmax,ymax corner
## of the 'rectangular grid'.
##
## Similarly, if over the 2nd quadrant, we started at xmax,ymin.
##
## And, if over the 4th quadrant, we started at xmin,ymax.
##
## Unfortunately, we cannot count on u,v in a certain quadrant of the
## -1.0 to 1.0 uv-square determining the far-ness/near-ness of points.
## Instead, we use a proc to sort the i,j indexes of the points
## on a 'z-depth' of the translated-rotated 3D points.
##
##+###################
## MATH CONSIDERATIONS (shading polygons): (to be implemented, someday)
##
## We will assume a light source coming from the viewer (i.e. parallel
## to the global z-axis), and do a dot-product of the normal of each
## polygon to the z-axis to determine a lighting factor to apply to
## the color of each polygon.
##
##+#########################################################################
## GUI FEATURES:
## This script provides a Tk GUI that includes the following widgets
## and features.
##
## 1) There is are 3 FUNCTION-ENTRY FIELDs on this GUI --- for
## 3 functions of $u and $v, corresponding to xyz coordinates.
##
## 2) There is a LISTBOX (on the left of the GUI) which provides a
## list of names of parametric-surfaces that can be selected.
## Selecting a name puts 3 expressions (in $u and $v) into the 3
## parametric-expression ENTRY FIELDs with a simple mouse click.
##
## 3) The user presses the Return/Enter key on an expression-entry field
## --- or uses a button3-release on the field --- to cause the
## selected/user-entered expression to be (re)plotted on the canvas.
##
## 4) There are 2 scales for setting longitude-latitude angles that
## determine the view direction --- and therby specify the direction
## of the projection (of 3D points onto a 2D 'viewing plane').
##
## 5) There are entry fields for the u-range and v-range of
## the rectangular grid to be used for the plot. (Note that these
## min,max values can be left at -1.0 and 1.0 and the coefficients
## of $u and $v in the 3 expressions can be adjusted, instead.)
##
## Also, there are two entry fields so that the user can
## enter integers Nuseg and Nvseg --- to specify how many
## segments will be used for the u and v sides of the
## rectangular 'independent variable domain'.
##
## 6) There are also some color buttons on the GUI that allow
## the user to specify
## - a 'fill'-color for the 4-sided polygons that make up the
## 3D surface being plotted
## - an 'outline'-color for the 4-sided polygons
## - a color for the background of the plot (the canvas).
##
##+#######################################################################
## 'CANONICAL' STRUCTURE OF THIS CODE:
##
## 0) Set general window parms (win-name, win-position, color-scheme,
## fonts,widget-geometry-parameters, win-size-control,text-for-labels-etc).
## 1a) Define ALL frames (and sub-frames, if any).
## 1b) Pack the frames and sub-frames.
## 2) Define & pack all widgets in the frames, frame-by-frame.
## Define ALL the widgets in a frame. Then pack them in the frame.
##
## 3) Define key and mouse/touchpad/touch-sensitive-screen 'event'
## BINDINGS, if needed.
## 4) Define PROCS, if needed.
## 5) Additional GUI initialization (typically with one or more of
## the procs), if needed.
##
##+#################################
## Some detail of the code structure of this particular script:
##
## 1a) Define ALL frames:
##
## Top-level :
## 'fRleft' - to contain a listbox and its scrollbars, and a zoom scale
## 'fRright' - to contain a canvas widget, with various widgets above it
##
## Sub-frames of 'fRleft' (top to bottom):
## - 'fRlistbox' - to contain one listbox widget with xy scrollbars
## - 'fRzoom' - to contain a scale widget
##
## Sub-frames of 'fRright' (top to bottom):
##
## 'fRbuttons' - to contain an 'Exit' button, a 'Help' button,
## 3 color-setting buttons, and
## a label widget to show current color parm values
## 'fRgridspecs' - entry widgets for u-range,v-range,Nusegs,Nvsegs
## 'fRviewparms' - entry widgets to specify a view direction -- via a
## longitude angle and a latitude angle
## 'fRfunction1' - to contain label & entry widgets for the x-expression
## 'fRfunction2' - to contain label & entry widgets for the y-expression
## 'fRfunction3' - to contain label & entry widgets for the z-expression
## 'fRcanvas' - to contain the canvas widget.
##
## 1b) Pack ALL frames.
##
## 2) Define & pack all widgets in the frames -- basically going through
## frames & their interiors in left-to-right and/or top-to-bottom order:
##
## 3) Define bindings:
## - Button1-release on the listbox (to fill the 3 expression entry fields)
##
## - Return/Enter key press on the 3 expression-entry widgets
## - Button3-release on the 3 expression-entry fields
##
## Also
## - Return and Button3-release on the u-range,v-range,Nusegs,Nvsegs
## entry widgets
## - Button1-release on the longitude,latitude,zoom scale widgets
##
## 4) Define procs:
## - 5 procs to do load-points-normals-arrays, translate-points-array,
## rotate-points-normals, sort-points, and then pixel-draw-the-polygons.
## - 3 procs for setting colors (fill, outline, background/canvas)
## - and some other procs (See the PROCS section in the code below.)
##
## The 5 load-translate-rotate-sort-draw procs are all executed whenever
## there is a change to any of the 3 xyz-expressions or the uv grid (min,
## max, or segs).
##
## The 3 rotate-sort-draw procs are executed whenever there is a change
## in either the longitude or latitude angle.
##
## The draw proc is executed whenever there is a 'simple' change, such as
## a color change (polygon or outline) or a change in the zoom scale.
##
## 5) Additional GUI initialization:
## - use the 5 load-translate-rotate-sort-draw procs to draw a plot
## on the canvas for an initial parametric-surface, initial
## grid-creation-parameters, and an initial view direction
## (longitude,latitude) --- to start the GUI with a non-empty canvas.
##
## ****
## NOTE: If a new parametric-surface is to be added to the listbox:
## ****
## The user can edit this script and add a 'parametric-surface-name'
## for 'insert end' statements for the surface-names 'listbox'.
##
## Also, for each surface-name added, the corresponding 3 expressions
## for x,y,z will need to be added. We put the name and the 3 expressions
## in the arrays aRsurfaceName($k), aRfunction1($k), aRfunction2($k),
## aRfunction3($k) where $k represents an integer index.
##
## These arrays are set just above the 'insert end' statements.
## Those 'insert end' statements are in 'code section 2', a
## define-and-pack-widgets section briefly described above.
##
##+#######################################################################
## DEVELOPED WITH: Tcl-Tk 8.5 on Ubuntu 9.10 (2009-october, 'Karmic Koala')
##
## $ wish
## % puts "$tcl_version $tk_version"
##
## showed
## 8.5 8.5
## but this script should work in most previous 8.x versions, and probably
## even in some 7.x versions (if font handling is made 'old-style').
##+#######################################################################
## MAINTENANCE HISTORY:
## Started by: Blaise Montandon 2012dec27 Started based on the f(x,y) script.
## Changed by: Blaise Montandon 2012
##+########################################################################
##+#######################################################################
## Set general window parms (title,position).
##+#######################################################################
wm title . "Generator-Examiner for 3D Parametric Surfaces of 2 variables"
wm iconname . "3DparaSurface"
wm geometry . +15+30
##+######################################################
## Set the color scheme for the window and its widgets ---
## such as entry field and listbox background color.
##+######################################################
tk_setPalette "#e0e0e0"
## Initialize the polygons color
## and the background color for the canvas.
# set COLOR1r 255
# set COLOR1g 255
# set COLOR1b 255
set COLOR1r 255
set COLOR1g 0
set COLOR1b 255
set COLOR1hex [format "#%02X%02X%02X" $COLOR1r $COLOR1g $COLOR1b]
# set COLOR2r 255
# set COLOR2g 255
# set COLOR2b 255
set COLOR2r 255
set COLOR2g 255
set COLOR2b 255
set COLOR2hex [format "#%02X%02X%02X" $COLOR2r $COLOR2g $COLOR2b]
# set COLORbkGNDr 60
# set COLORbkGNDg 60
# set COLORbkGNDb 60
set COLORbkGNDr 0
set COLORbkGNDg 0
set COLORbkGNDb 0
set COLORbkGNDhex \
[format "#%02X%02X%02X" $COLORbkGNDr $COLORbkGNDg $COLORbkGNDb]
set listboxBKGD "#f0f0f0"
set entryBKGD "#f0f0f0"
set scaleBKGD "#f0f0f0"
set radbuttBKGD "#f0f0f0"
##+########################################################
## Use a VARIABLE-WIDTH font for text on label and
## button widgets.
##
## Use a FIXED-WIDTH font for the listbox list and for
## the text in the entry field.
##+########################################################
font create fontTEMP_varwidth \
-family {comic sans ms} \
-size -14 \
-weight bold \
-slant roman
font create fontTEMP_SMALL_varwidth \
-family {comic sans ms} \
-size -10 \
-weight bold \
-slant roman
## Some other possible (similar) variable width fonts:
## Arial
## Bitstream Vera Sans
## DejaVu Sans
## Droid Sans
## FreeSans
## Liberation Sans
## Nimbus Sans L
## Trebuchet MS
## Verdana
font create fontTEMP_fixedwidth \
-family {liberation mono} \
-size -14 \
-weight bold \
-slant roman
font create fontTEMP_SMALL_fixedwidth \
-family {liberation mono} \
-size -10 \
-weight bold \
-slant roman
## Some other possible fixed width fonts (esp. on Linux):
## Andale Mono
## Bitstream Vera Sans Mono
## Courier 10 Pitch
## DejaVu Sans Mono
## Droid Sans Mono
## FreeMono
## Nimbus Mono L
## TlwgMono
##+###########################################################
## SET GEOM VARS FOR THE VARIOUS WIDGET DEFINITIONS.
## (e.g. width and height of canvas, and padding for Buttons)
##+###########################################################
## CANVAS widget geom settings:
set initCanWidthPx 300
set initCanHeightPx 300
set minCanWidthPx 100
set minCanHeightPx 24
# set BDwidthPx_canvas 2
set BDwidthPx_canvas 0
## BUTTON widget geom settings:
set PADXpx_button 0
set PADYpx_button 0
set BDwidthPx_button 2
## ENTRY widget geom settings:
set BDwidthPx_entry 2
set initFuncEntryWidthChars 20
set uvEntriesWidthChars 5
## LISTBOX geom settings:
set BDwidthPx_listbox 2
set initListboxWidthChars 30
set initListboxHeightChars 8
## SCALE geom parameters:
set BDwidthPx_scale 2
set initScaleLengthPx 200
## RADIOBUTTON geom parameters:
set PADXpx_radbutt 0
set PADYpx_radbutt 0
set BDwidthPx_radbutt 2
## CHECKBUTTON geom parameters:
set PADXpx_chkbutt 0
set PADYpx_chkbutt 0
set BDwidthPx_chkbutt 2
##+######################################################
## Set a MINSIZE of the window (roughly):
##
## MIN-WIDTH according to the approx min width of the
## listbox and function-entry widgets (about 20 chars each)
##
## MIN-HEIGHT according to the approx min height of the
## listbox widget, about 8 lines.
##+######################################################
set charWidthPx [font measure fontTEMP_fixedwidth "0"]
## FOR MIN-WIDTH:
## Use the init width of the listbox and entry widgets, in chars,
## to calculate their total width in pixels. Then add some
## pixels to account for right-left-size of window-manager decoration,
## frame/widget borders, and the vertical listbox scrollbar.
set minWinWidthPx [expr {20 + ( $initListboxWidthChars * $charWidthPx ) + \
( $initFuncEntryWidthChars * $charWidthPx )}]
set charHeightPx [font metrics fontTEMP_fixedwidth -linespace]
## FOR MIN-HEIGHT:
## Get the height of the init number of lines in the listbox
## and add about 20 pixels for top-bottom window decoration --
## and about 8 pixels for frame/widget borders.
set minWinHeightPx [expr {28 + ( $initListboxHeightChars * $charHeightPx )}]
## FOR TESTING:
# puts "minWinWidthPx = $minWinWidthPx"
# puts "minWinHeightPx = $minWinHeightPx"
wm minsize . $minWinWidthPx $minWinHeightPx
## We allow the window to be resizable and we pack the canvas with
## '-fill both' so that the canvas can be enlarged by enlarging the
## window.
##
## Just press the Enter key on an entry field (or use button3-release
## on an entry field) --- or use button1-release on a scale wdiget ---
## or any perform any 'event' to cause the pixel-draw proc to execute ---
## to re-fill the canvas according to the the user-specified functions
## and grid --- and the current canvas dimensions.
## If you want to make the window un-resizable,
## you can use the following statement.
# wm resizable . 0 0
##+####################################################################
## Set a TEXT-ARRAY to hold text for buttons & labels on the GUI.
## NOTE: This can aid INTERNATIONALIZATION. This array can
## be set according to a nation/region parameter.
##+####################################################################
## if { "$VARlocale" == "en"}
set aRtext(labelZOOM) "Zoom:"
set aRtext(buttonEXIT) "Exit"
set aRtext(buttonHELP) "Help"
set aRtext(buttonCOLOR1) "Polygon
Fill Color"
set aRtext(buttonCOLOR2) "Polygon
Outline Color"
set aRtext(buttonBkgdCOLOR) "Background
Color"
set aRtext(radbuttFILL) "Fill polys"
set aRtext(radbuttOUTLINE) "Outline polys"
set aRtext(radbuttBOTH) "Both"
set aRtext(labelGRID) "Grid:"
set aRtext(labelUMIN) " umin"
set aRtext(labelUMAX) " umax"
set aRtext(labelUSEGS) " u-segs"
set aRtext(labelVMIN) " vmin"
set aRtext(labelVMAX) " vmax"
set aRtext(labelVSEGS) " v-segs"
set aRtext(labelVIEW) "View via 2 angles
longitude,latitude:"
# set aRtext(scaleLON) "longitude"
# set aRtext(scaleLAT) "latitude"
set aRtext(labelFUNCTION1) "x-Function of 2 vars (\$u & \$v):"
set aRtext(labelFUNCTION2) "y-Function of 2 vars (\$u & \$v):"
set aRtext(labelFUNCTION3) "z-Function of 2 vars (\$u & \$v):"
## END OF if { "$VARlocale" == "en"}
##+################################################################
## DEFINE *ALL* THE FRAMES:
##
## Top-level : '.fRleft' , '.fRright'
##
## Sub-frames: '.fRleft.fRlistbox' and '.fRleft.fRzoom'
##
## '.fRright.fRbuttons' and '.fRright.fRgridspecs' and
## '.fRright.fRviewparms' and
## '.fRright.fRfunction1' and '.fRright.fRfunction2' and
## '.fRright.fRfunction3' and '.fRright.fRcan'
##
##+################################################################
## FOR TESTING: (esp. to check behavior during window expansion)
# set BDwidth_frame 2
# set RELIEF_frame raised
set BDwidth_frame 0
set RELIEF_frame flat
frame .fRleft -relief $RELIEF_frame -borderwidth $BDwidth_frame
frame .fRright -relief $RELIEF_frame -borderwidth $BDwidth_frame
frame .fRleft.fRlistbox -relief $RELIEF_frame -borderwidth $BDwidth_frame
frame .fRleft.fRzoom -relief $RELIEF_frame -borderwidth $BDwidth_frame
frame .fRright.fRbuttons -relief $RELIEF_frame -bd $BDwidth_frame
frame .fRright.fRgridspecs -relief $RELIEF_frame -bd $BDwidth_frame
frame .fRright.fRviewparms -relief $RELIEF_frame -bd $BDwidth_frame
frame .fRright.fRfunction1 -relief $RELIEF_frame -bd $BDwidth_frame
frame .fRright.fRfunction2 -relief $RELIEF_frame -bd $BDwidth_frame
frame .fRright.fRfunction3 -relief $RELIEF_frame -bd $BDwidth_frame
frame .fRright.fRcan -relief $RELIEF_frame -bd $BDwidth_frame
##+##############################
## PACK the FRAMES.
##+##############################
pack .fRleft \
-side left \
-anchor nw \
-fill both \
-expand 1
pack .fRright \
-side left \
-anchor nw \
-fill both \
-expand 1
## Pack the sub-frames.
pack .fRleft.fRlistbox \
-side top \
-anchor nw \
-fill both \
-expand 1
pack .fRleft.fRzoom \
-side top \
-anchor nw \
-fill x \
-expand 0
pack .fRright.fRbuttons \
.fRright.fRgridspecs \
.fRright.fRviewparms \
.fRright.fRfunction1 \
.fRright.fRfunction2 \
.fRright.fRfunction3 \
-side top \
-anchor nw \
-fill x \
-expand 0
pack .fRright.fRcan \
-side top \
-anchor nw \
-fill both \
-expand 1
##+######################################################
## In FRAME '.fRleft.fRlistbox' -
## DEFINE-and-PACK a LISTBOX WIDGET,
## with scrollbars --- for a list of functions of 2 vars.
##+######################################################
listbox .fRleft.fRlistbox.listbox \
-width $initListboxWidthChars \
-height $initListboxHeightChars \
-font fontTEMP_fixedwidth \
-relief raised \
-borderwidth $BDwidthPx_listbox \
-state normal \
-yscrollcommand ".fRleft.fRlistbox.scrbary set" \
-xscrollcommand ".fRleft.fRlistbox.scrbarx set"
scrollbar .fRleft.fRlistbox.scrbary \
-orient vertical \
-command ".fRleft.fRlistbox.listbox yview"
scrollbar .fRleft.fRlistbox.scrbarx \
-orient horizontal \
-command ".fRleft.fRlistbox.listbox xview"
##+##########################################################
## Define array entries to hold surface-names and the 3
## xyz expressions for each surface-name.
##
## Update the 'numSurfaces' setting if you add surfaces here.
##+##########################################################
set aRsurfaceName(1) {sphere/ellipsoid}
set aRfunction1(1) {1.0 * cos($pi * $u) * cos($pihalf * $v)}
set aRfunction2(1) {1.0 * sin($pi * $u) * cos($pihalf * $v)}
set aRfunction3(1) {1.0 * sin($pihalf * $v)}
set aRsurfaceName(2) {cylinder/extruded-circle}
set aRfunction1(2) {1.0 * cos($pi * $u)}
set aRfunction2(2) {1.0 * sin($pi * $u)}
set aRfunction3(2) {2.0*$v}
set aRsurfaceName(3) {cone-frustrum}
set aRfunction1(3) {($v + 2.0) * cos($pi * $u)}
set aRfunction2(3) {($v + 2.0) * sin($pi * $u)}
set aRfunction3(3) {$v}
set aRsurfaceName(4) {torus}
set aRfunction1(4) {(10.0 + 2.0 * cos($pi * $u)) * sin($pi * $v)}
set aRfunction2(4) {(10.0 + 2.0 * cos($pi * $u)) * cos($pi * $v)}
set aRfunction3(4) {2.0 * sin($pi * $u)}
set aRsurfaceName(5) {seashell}
set aRfunction1(5) {2.0 * ( 1.0 - exp($u + 1.0)) * cos(6.0 * $pi * $u) * cos($pi * $v) * cos($pi * $v)}
set aRfunction2(5) {2.0 * (-1.0 + exp($u + 1.0)) * sin(6.0 * $pi * $u) * cos($pi * $v) * cos($pi * $v)}
set aRfunction3(5) {1.0 - exp(2.0 * ($u + 1.0)) - sin($twopi * $v) + exp($u + 1.0) * sin($twopi * $v)}
set aRsurfaceName(6) {mobius-strip}
set aRfunction1(6) {($v / 2.0) * sin($pihalf * $u)}
set aRfunction2(6) {(1.0 + (($v / 2.0) * cos($pihalf * $u))) * sin($pi * $u)}
set aRfunction3(6) {(1.0 + (($v / 2.0) * cos($pihalf * $u))) * cos($pi * $u)}
set aRsurfaceName(7) {ennepers-surface}
set aRfunction1(7) {$u - (($u * $u * $u) / 3.0) + ($u *$v * $v)}
set aRfunction2(7) {$v - (($v * $v * $v) / 3.0) + ($u *$u * $v)}
set aRfunction3(7) {($u * $u) - ($v * $v)}
set aRsurfaceName(8) {whitney-umbrella}
set aRfunction1(8) {$u * $v}
set aRfunction2(8) {$u}
set aRfunction3(8) {$v * $v}
set aRsurfaceName(9) {a-lissajous-surface}
set aRfunction1(9) {sin($pi * $u)}
set aRfunction2(9) {sin($pi * $v)}
set aRfunction3(9) {sin( -(($pi * $u) + ($pi * $v)) )}
set aRsurfaceName(10) {steiner-surface}
set aRfunction1(10) {sin($twopi * $u) * cos($pihalf * $v) * cos($pihalf * $v)}
set aRfunction2(10) {sin($pi * $u) * sin($pi * $v)}
set aRfunction3(10) {cos($pi * $u) * sin($pi * $v)}
set aRsurfaceName(11) {helicoid}
set aRfunction1(11) {1.0 * $v * cos($twopi * $u)}
set aRfunction2(11) {1.0 * $v * sin($twopi * $u)}
set aRfunction3(11) {2.0 * $u}
set aRsurfaceName(12) {catenoid}
set aRfunction1(12) {2.0 * cos($twopi * $u) * cosh($v/2.0)}
set aRfunction2(12) {2.0 * sin($twopi * $u) * cosh($v/2.0)}
set aRfunction3(12) {$v}
set aRsurfaceName(13) {hyperboloid-of-one-sheet}
set aRfunction1(13) {1.0 * cosh(2.0 * $u) * cos($pi * $v)}
set aRfunction2(13) {1.1 * cosh(2.0 * $u) * sin($pi * $v)}
set aRfunction3(13) {1.2 * sinh(2.0 * $u)}
set aRsurfaceName(14) {umbilic-torus-of-helaman-ferguson}
set aRfunction1(14) {sin($pi*$u) * ( 7.0 + cos(($pi*$u/3.0) - (2.0*$pi*$v)) + 2.0 * cos(($pi*$u/3.0) + ($pi*$v)) )}
set aRfunction2(14) {cos($pi*$u) * ( 7.0 + cos(($pi*$u/3.0) - (2.0*$pi*$v)) + 2.0 * cos(($pi*$u/3.0) + ($pi*$v)) )}
set aRfunction3(14) { sin(($pi*$u/3.0) - (2.0*$pi*$v)) + 2.0 * sin(($pi*$u/3.0) + ($pi*$v)) }
set aRsurfaceName(15) {conical-spiral}
set aRfunction1(15) {$u*1.2*$v*sin(1.0*$twopi*$v)}
set aRfunction2(15) {$u*1.2*$v*cos(1.0*$twopi*$v)}
set aRfunction3(15) {$v}
set aRsurfaceName(16) {astroidal-ellipse}
set aRfunction1(16) {pow( 1.0*cos($pi*$u)*cos($pi*$v) , 3)}
set aRfunction2(16) {pow( 1.0*sin($pi*$u)*cos($pi*$v) , 3)}
set aRfunction3(16) {pow( 1.0*sin($pi*$v) , 3)}
set aRsurfaceName(17) {wavy-sphere}
set aRfunction1(17) {cos($pi*$u)*cos($pihalf*$v) + 0.05 * cos(5.0*$pi*$v)}
set aRfunction2(17) {sin($pi*$u)*cos($pihalf*$v) + 0.05 * cos(5.0*$pi*$u)}
set aRfunction3(17) {sin($pihalf*$v)}
set aRsurfaceName(18) {bag-with-seam}
set aRfunction1(18) {($v + 1.0) * cos($pi*$u)}
set aRfunction2(18) {( ($v + 1.0) - (1.26 * $pi * ($u + 1.0)) ) * sin($pi*$u)}
set aRfunction3(18) {2.47 * ($v + 1.0) * ($v + 1.0)}
set aRsurfaceName(19) {bananas}
set aRfunction1(19) {( 2.0 + sin($pi*$v)*sin($pi*$u)) * sin(3.0*$pihalf*$v)}
set aRfunction2(19) {( 2.0 + sin($pi*$v)*sin($pi*$u)) * cos(3.0*$pihalf*$v)}
set aRfunction3(19) {sin($pi*$v)*cos($pi*$u) + 4.0 * $v - 2.0}
set aRsurfaceName(20) {accordion-tube}
set aRfunction1(20) {sin($pi*$u) + 0.25*sin(2.0*$twopi*$v)}
set aRfunction2(20) {cos($pi*$u)}
set aRfunction3(20) {4.0*$v}
set aRsurfaceName(21) {eggs-holder}
set aRfunction1(21) {$u}
set aRfunction2(21) {$v}
set aRfunction3(21) {0.05*( sin(2.0*$twopi*$v) + sin(2.0*$twopi*$u) )}
set numSurfaces 21
##+#####################################################################
## NOTE:
## In a label widget defined in a right-frame, like .fRright.fRviewparms,
## we will show the number of surfaces provided, in a label in the GUI ---
## for users to know how many are in the listbox, perhaps out of sight.
## Also put some GUI usage help info in the same label.
##+#####################################################################
##+############################################################
## Insert each surface-name into the listbox list.
##+############################################################
## NOTE: We can change the order of surface names in the list
## by moving around the subscripts or array-groups above.
##+############################################################
## Make sure the listbox is empty.
.fRleft.fRlistbox.listbox delete 0 end
for {set k 1} {$k <= $numSurfaces} {incr k} {
.fRleft.fRlistbox.listbox insert end "$aRsurfaceName($k)"
}
## Pack the listbox and its scrollbars.
pack .fRleft.fRlistbox.scrbary \
-side right \
-anchor e \
-fill y \
-expand 0
pack .fRleft.fRlistbox.scrbarx \
-side bottom \
-anchor s \
-fill x \
-expand 0
## We need to pack the listbox AFTER
## the scrollbars, to get the scrollbars
## positioned properly --- BEFORE
## the listbox FILLS the pack area.
pack .fRleft.fRlistbox.listbox \
-side top \
-anchor nw \
-fill both \
-expand 1
##+######################################################
## In FRAME '.fRleft.fRzoom' -
## DEFINE-and-PACK a LABEL & SCALE WIDGET.
##+######################################################
## Define a label widget to precede the zoom-scale.
label .fRleft.fRzoom.labelZOOM \
-text "$aRtext(labelZOOM)" \
-font fontTEMP_varwidth \
-justify left \
-anchor w \
-relief flat \
-bd $BDwidthPx_button
## We set the initial value for this 'scaleZOOM' widget in the
## GUI initialization section at the bottom of this script.
# set curZOOM 1.0
# set curZOOM 0.8
scale .fRleft.fRzoom.scaleZOOM \
-orient horizontal \
-resolution 0.1 \
-from 0.1 -to 10.0 \
-digits 3 \
-length 200 \
-repeatdelay 500 \
-repeatinterval 50 \
-font fontTEMP_varwidth \
-troughcolor "$scaleBKGD" \
-variable curZOOM
# -command "wrap_draw_2D_pixel_polys 0"
## PACK the widgets of FRAME .fRleft.fRzoom ---
## label and scale.
pack .fRleft.fRzoom.labelZOOM \
-side left \
-anchor w \
-fill none \
-expand 0
pack .fRleft.fRzoom.scaleZOOM \
-side left \
-anchor w \
-fill none \
-expand 0
## Using '-fill x -expand 1' with redraws on changing the zoom
## may cause the scale to 'go crazy' if you click in the trough.
## The sliderbar keeps advancing on its own and many redraws are done.
## This may happen in conjunction with the <Configure> binding
## on the canvas widget.
## For now, we use '-fill none -expand 0'.
##+####################################
## In FRAME '.fRright.fRbuttons' -
## DEFINE-and-PACK 'BUTTON' WIDGETS
## --- exit and color buttons, and
## a label to show current color vals.
## Also checkbuttons for fill, outline.
##+####################################
button .fRright.fRbuttons.buttEXIT \
-text "$aRtext(buttonEXIT)" \
-font fontTEMP_varwidth \
-padx $PADXpx_button \
-pady $PADYpx_button \
-relief raised \
-bd $BDwidthPx_button \
-command {exit}
button .fRright.fRbuttons.buttHELP \
-text "$aRtext(buttonHELP)" \
-font fontTEMP_varwidth \
-padx $PADXpx_button \
-pady $PADYpx_button \
-relief raised \
-bd $BDwidthPx_button \
-command {popup_msg_var_scroll "$HELPtext"}
button .fRright.fRbuttons.buttCOLOR1 \
-text "$aRtext(buttonCOLOR1)" \
-font fontTEMP_SMALL_varwidth \
-padx $PADXpx_button \
-pady $PADYpx_button \
-relief raised \
-bd $BDwidthPx_button \
-command "set_polygon_color1"
button .fRright.fRbuttons.buttCOLOR2 \
-text "$aRtext(buttonCOLOR2)" \
-font fontTEMP_SMALL_varwidth \
-padx $PADXpx_button \
-pady $PADYpx_button \
-relief raised \
-bd $BDwidthPx_button \
-command "set_polygon_color2"
button .fRright.fRbuttons.buttCOLORbkGND \
-text "$aRtext(buttonBkgdCOLOR)" \
-font fontTEMP_SMALL_varwidth \
-padx $PADXpx_button \
-pady $PADYpx_button \
-relief raised \
-bd $BDwidthPx_button \
-command "set_background_color"
label .fRright.fRbuttons.labelCOLORS \
-text "" \
-font fontTEMP_SMALL_varwidth \
-justify left \
-anchor w \
-relief flat \
-bd $BDwidthPx_button
## We set the initial value for these radiobutton widgets in the
## GUI initialization section at the bottom of this script.
# set poly_filloutboth "both"
radiobutton .fRright.fRbuttons.radbuttFILL \
-text "$aRtext(radbuttFILL)" \
-font fontTEMP_varwidth \
-anchor w \
-variable poly_filloutboth \
-value "fill" \
-selectcolor "$radbuttBKGD" \
-relief flat \
-padx $PADXpx_radbutt \
-pady $PADYpx_radbutt \
-bd $BDwidthPx_radbutt
radiobutton .fRright.fRbuttons.radbuttOUTLINE \
-text "$aRtext(radbuttOUTLINE)" \
-font fontTEMP_varwidth \
-anchor w \
-variable poly_filloutboth \
-value "outline" \
-selectcolor "$radbuttBKGD" \
-relief flat \
-padx $PADXpx_radbutt \
-pady $PADYpx_radbutt \
-bd $BDwidthPx_radbutt
radiobutton .fRright.fRbuttons.radbuttBOTH \
-text "$aRtext(radbuttBOTH)" \
-font fontTEMP_varwidth \
-anchor w \
-variable poly_filloutboth \
-value "both" \
-selectcolor "$radbuttBKGD" \
-relief flat \
-padx $PADXpx_radbutt \
-pady $PADYpx_radbutt \
-bd $BDwidthPx_radbutt
## Pack the 'frbuttons' widgets.
pack .fRright.fRbuttons.buttEXIT \
.fRright.fRbuttons.buttHELP \
.fRright.fRbuttons.buttCOLOR1 \
.fRright.fRbuttons.buttCOLOR2 \
.fRright.fRbuttons.buttCOLORbkGND \
.fRright.fRbuttons.labelCOLORS \
-side left \
-anchor w \
-fill none \
-expand 0
pack .fRright.fRbuttons.radbuttFILL \
.fRright.fRbuttons.radbuttOUTLINE \
.fRright.fRbuttons.radbuttBOTH \
-side left \
-anchor w \
-fill none \
-expand 0
# -side right \
# -anchor e \
# -fill none \
# -expand 0
##+#########################################
## In FRAME '.fRright.fRgridspecs' -
## DEFINE-and-PACK LABEL & ENTRY WIDGETS
## --- for u-range and v-range (the 'domain'
## of the 2 independent variables) --- and
## for Nusegs and Nvsegs (the number of segments
## into which to break the u and v sides of the
## domain rectangle).
##+#########################################
label .fRright.fRgridspecs.labelGRID \
-text "$aRtext(labelGRID)" \
-font fontTEMP_varwidth \
-justify left \
-anchor w \
-relief flat \
-bd 0
label .fRright.fRgridspecs.labelUMIN \
-text "$aRtext(labelUMIN)" \
-font fontTEMP_varwidth \
-justify left \
-anchor w \
-relief flat \
-bd 0
## We set the initial value for this entry widget in the
## GUI initialization section at the bottom of this script.
# set ENTRYumin "-10."
entry .fRright.fRgridspecs.entUMIN \
-textvariable ENTRYumin \
-bg $entryBKGD \
-font fontTEMP_fixedwidth \
-width $uvEntriesWidthChars \
-relief sunken \
-bd $BDwidthPx_entry
label .fRright.fRgridspecs.labelUMAX \
-text "$aRtext(labelUMAX)" \
-font fontTEMP_varwidth \
-justify left \
-anchor w \
-relief flat \
-bd 0
## We set the initial value for this entry widget in the
## GUI initialization section at the bottom of this script.
# set ENTRYumax "10."
entry .fRright.fRgridspecs.entUMAX \
-textvariable ENTRYumax \
-bg $entryBKGD \
-font fontTEMP_fixedwidth \
-width $uvEntriesWidthChars \
-relief sunken \
-bd $BDwidthPx_entry
label .fRright.fRgridspecs.labelUSEGS \
-text "$aRtext(labelUSEGS)" \
-font fontTEMP_varwidth \
-justify left \
-anchor w \
-relief flat \
-bd 0
## We set the initial value for this entry widget in the
## GUI initialization section at the bottom of this script.
# set ENTRYusegs 10
entry .fRright.fRgridspecs.entUSEGS \
-textvariable ENTRYusegs \
-bg $entryBKGD \
-font fontTEMP_fixedwidth \
-width $uvEntriesWidthChars \
-relief sunken \
-bd $BDwidthPx_entry
## AND THE WIDGETS FOR VMIN,VMAX,VSEGS.
label .fRright.fRgridspecs.labelVMIN \
-text "$aRtext(labelVMIN)" \
-font fontTEMP_varwidth \
-justify left \
-anchor w \
-relief flat \
-bd 0
## We set the initial value for this entry widget in the
## GUI initialization section at the bottom of this script.
# set ENTRYvmin "-10."
entry .fRright.fRgridspecs.entVMIN \
-textvariable ENTRYvmin \
-bg $entryBKGD \
-font fontTEMP_fixedwidth \
-width $uvEntriesWidthChars \
-relief sunken \
-bd $BDwidthPx_entry
label .fRright.fRgridspecs.labelVMAX \
-text "$aRtext(labelVMAX)" \
-font fontTEMP_varwidth \
-justify left \
-anchor w \
-relief flat \
-bd 0
## We set the initial value for this entry widget in the
## GUI initialization section at the bottom of this script.
# set ENTRYvmax "10."
entry .fRright.fRgridspecs.entVMAX \
-textvariable ENTRYvmax \
-bg $entryBKGD \
-font fontTEMP_fixedwidth \
-width $uvEntriesWidthChars \
-relief sunken \
-bd $BDwidthPx_entry
label .fRright.fRgridspecs.labelVSEGS \
-text "$aRtext(labelVSEGS)" \
-font fontTEMP_varwidth \
-justify left \
-anchor w \
-relief flat \
-bd 0
## We set the initial value for this entry widget in the
## GUI initialization section at the bottom of this script.
# set ENTRYvsegs 10
entry .fRright.fRgridspecs.entVSEGS \
-textvariable ENTRYvsegs \
-bg $entryBKGD \
-font fontTEMP_fixedwidth \
-width $uvEntriesWidthChars \
-relief sunken \
-bd $BDwidthPx_entry
##+##################################################
## Pack the '.fRright.fRgridspecs' frame's widgets
## --- for entering umin,umax,Nusegs,vmin,vmax,Nvsegs.
##+##################################################
pack .fRright.fRgridspecs.labelGRID \
-side left \
-anchor w \
-fill none \
-expand 0
pack .fRright.fRgridspecs.labelUMIN \
-side left \
-anchor w \
-fill none \
-expand 0
pack .fRright.fRgridspecs.entUMIN \
-side left \
-anchor w \
-fill x \
-expand 1
pack .fRright.fRgridspecs.labelUMAX \
-side left \
-anchor w \
-fill none \
-expand 0
pack .fRright.fRgridspecs.entUMAX \
-side left \
-anchor w \
-fill x \
-expand 1
pack .fRright.fRgridspecs.labelUSEGS \
-side left \
-anchor w \
-fill none \
-expand 0
pack .fRright.fRgridspecs.entUSEGS \
-side left \
-anchor w \
-fill x \
-expand 1
## FOR Y:
pack .fRright.fRgridspecs.labelVMIN \
-side left \
-anchor w \
-fill none \
-expand 0
pack .fRright.fRgridspecs.entVMIN \
-side left \
-anchor w \
-fill x \
-expand 1
pack .fRright.fRgridspecs.labelVMAX \
-side left \
-anchor w \
-fill none \
-expand 0
pack .fRright.fRgridspecs.entVMAX \
-side left \
-anchor w \
-fill x \
-expand 1
pack .fRright.fRgridspecs.labelVSEGS \
-side left \
-anchor w \
-fill none \
-expand 0
pack .fRright.fRgridspecs.entVSEGS \
-side left \
-anchor w \
-fill x \
-expand 1
##+################################################
## In FRAME '.fRright.fRviewparms' -
## DEFINE-and-PACK a pair of LABEL & SCALE WIDGETS
## --- for 2 rotation angles, longitude & latitude.
##
## Also provide a label widget in which to
## show help and/or 'status' info.
##+################################################
label .fRright.fRviewparms.labelVIEW \
-text "$aRtext(labelVIEW)" \
-font fontTEMP_varwidth \
-justify left \
-anchor w \
-relief flat \
-bd 0
## We will set initial values for the
## following 2 scales in the
## additional-GUI-initialization section
## at the bottom of this script.
## This 'scaleLON' is for the longitudinal angle,
## which we allow to range from 0 to 360 degrees.
scale .fRright.fRviewparms.scaleLON \
-orient horizontal \
-resolution 1 \
-from 0 -to 360 \
-digits 4 \
-length 180 \
-repeatdelay 500 \
-repeatinterval 50 \
-font fontTEMP_varwidth \
-troughcolor "$scaleBKGD"
# -label "$aRtext(scaleLON)" \
# -command {rotate_proJECT}
## We do NOT use the '-variable' option.
## It may cause 'auto-repeat' problems.
# -variable angLON \
## This 'scaleLAT' is for the latitudinal angle,
## which we allow to range from 0 to 180 degrees.
scale .fRright.fRviewparms.scaleLAT \
-orient horizontal \
-resolution 1 \
-from -90 -to 90 \
-digits 3 \
-length 90 \
-repeatdelay 500 \
-repeatinterval 50 \
-font fontTEMP_varwidth \
-troughcolor "$scaleBKGD"
# -from 0 -to 180 \
# -label "$aRtext(scaleLAT)" \
# -command {rotate_proJECT}
## We do NOT use the '-variable' option.
## It may cause 'auto-repeat' problems.
# -variable viewZ \
label .fRright.fRviewparms.labelSTATUS \
-text "\
$numSurfaces surface-names are in the listbox. Select one or enter your own
expressions for x,y,z in terms of \$u and \$v, below.
You can change values for func-coeffs, grid, view, zoom. Press Enter
when in an entry field (or MouseButn3-click an entry field) to replot." \
-font fontTEMP_SMALL_varwidth \
-justify left \
-anchor w \
-relief flat \
-bd $BDwidthPx_button
##+###############################################
## Pack the '.fRright.fRviewparms' frame's widgets
## --- for projection vector and help/status info.
##+###############################################
pack .fRright.fRviewparms.labelVIEW \
-side left \
-anchor w \
-fill none \
-expand 0
pack .fRright.fRviewparms.scaleLON \
.fRright.fRviewparms.scaleLAT \
-side left \
-anchor w \
-fill none \
-expand 0
pack .fRright.fRviewparms.labelSTATUS \
-side left \
-anchor w \
-fill none \
-expand 0
##+###############################
## In FRAME '.fRright.fRfunction1' -
## DEFINE-and-PACK LABEL & ENTRY.
##+###############################
label .fRright.fRfunction1.labelFUNC1 \
-text "$aRtext(labelFUNCTION1)" \
-font fontTEMP_varwidth \
-justify left \
-anchor w \
-relief flat \
-bd 0
## We set an initial function1 in the GUI initialization
## section at the bottom of this script.
entry .fRright.fRfunction1.entFUNC1 \
-textvariable ENTRYfunction1 \
-bg $entryBKGD \
-font fontTEMP_fixedwidth \
-width $initFuncEntryWidthChars \
-relief sunken \
-bd $BDwidthPx_entry
## Pack the function1 widgets.
pack .fRright.fRfunction1.labelFUNC1 \
-side left \
-anchor w \
-fill none \
-expand 0
pack .fRright.fRfunction1.entFUNC1 \
-side left \
-anchor w \
-fill x \
-expand 1
##+###############################
## In FRAME '.fRright.fRfunction2' -
## DEFINE-and-PACK LABEL & ENTRY.
##+###############################
label .fRright.fRfunction2.labelFUNC2 \
-text "$aRtext(labelFUNCTION2)" \
-font fontTEMP_varwidth \
-justify left \
-anchor w \
-relief flat \
-bd 0
## We set an initial function2 in the GUI initialization
## section at the bottom of this script.
entry .fRright.fRfunction2.entFUNC2 \
-textvariable ENTRYfunction2 \
-bg $entryBKGD \
-font fontTEMP_fixedwidth \
-width $initFuncEntryWidthChars \
-relief sunken \
-bd $BDwidthPx_entry
## Pack the function2 widgets.
pack .fRright.fRfunction2.labelFUNC2 \
-side left \
-anchor w \
-fill none \
-expand 0
pack .fRright.fRfunction2.entFUNC2 \
-side left \
-anchor w \
-fill x \
-expand 1
##+###############################
## In FRAME '.fRright.fRfunction3' -
## DEFINE-and-PACK LABEL & ENTRY.
##+###############################
label .fRright.fRfunction3.labelFUNC3 \
-text "$aRtext(labelFUNCTION3)" \
-font fontTEMP_varwidth \
-justify left \
-anchor w \
-relief flat \
-bd 0
## We set an initial function3 in the GUI initialization
## section at the bottom of this script.
entry .fRright.fRfunction3.entFUNC3 \
-textvariable ENTRYfunction3 \
-bg $entryBKGD \
-font fontTEMP_fixedwidth \
-width $initFuncEntryWidthChars \
-relief sunken \
-bd $BDwidthPx_entry
## Pack the function3 widgets.
pack .fRright.fRfunction3.labelFUNC3 \
-side left \
-anchor w \
-fill none \
-expand 0
pack .fRright.fRfunction3.entFUNC3 \
-side left \
-anchor w \
-fill x \
-expand 1
##+###############################
## In FRAME '.fRright.fRcan' -
## DEFINE-and-PACK a CANVAS WIDGET:
##+###############################
## We set '-highlightthickness' and '-borderwidth' to
## zero, to avoid covering some of the viewable area
## of the canvas, as suggested on page 558 of the 4th
## edition of 'Practical Programming with Tcl and Tk'.
##+###################################################
canvas .fRright.fRcan.can \
-width $initCanWidthPx \
-height $initCanHeightPx \
-relief raised \
-highlightthickness 0 \
-borderwidth 0
pack .fRright.fRcan.can \
-side top \
-anchor nw \
-fill both \
-expand 1
##+##################################################
## END OF DEFINITION of the GUI widgets.
##+##################################################
## Start of BINDINGS, PROCS, Added-GUI-INIT sections.
##+##################################################
##+#######################################################################
##+#######################################################################
## BINDINGS SECTION:
## - For MB1-release on a listbox line, we call the proc
## listboxSelectionTOentryStrings.
##
## - For Enter-key-press on any of the umin,umax,usegs,vmin,vmax,vsegs
## entry fields, call the set of procs that do a complete redraw.
##
## - For MB1-release on any of the umin,umax,usegs,vmin,vmax,vsegs
## entry fields, call the set of procs that do a complete redraw.
##
## Also bindings on the longitude-latitude scale widgets.
##
## Also bindings on fill/outline/both radiobuttons and on the zoom scale.
##+#######################################################################
## A sequence of up to 5 procs may be used to perform a draw:
## - load_points_array
## - translate_points_array
## - rotate_points
## - sort_polyIDs_list
## - draw_2D_pixel_polys
## The bindings on the 3 'entFUNC' widgets would do all 5: load-translate-rotate-sort-draw.
## The bindings on the umin,...,vsegs entry fields would do all 5.
## The bindings on the longitude-latitude scales would do the last 3: rotate-sort-draw.
## The bindings on the fill/outline/both radiobutons would do the last 1: draw.
## The binding on the zoom scale would do the last 1.
## The fill and outline color button procs would do the last 1.
##+#######################################################################
bind .fRleft.fRlistbox.listbox <ButtonRelease-1> { listboxSelectionTOentryStrings }
bind .fRright.fRfunction1.entFUNC1 <Return> "load-translate-rotate-sort-draw"
bind .fRright.fRfunction1.entFUNC1 <ButtonRelease-3> "load-translate-rotate-sort-draw"
bind .fRright.fRfunction2.entFUNC2 <Return> "load-translate-rotate-sort-draw"
bind .fRright.fRfunction2.entFUNC2 <ButtonRelease-3> "load-translate-rotate-sort-draw"
bind .fRright.fRfunction3.entFUNC3 <Return> "load-translate-rotate-sort-draw"
bind .fRright.fRfunction3.entFUNC3 <ButtonRelease-3> "load-translate-rotate-sort-draw"
bind .fRright.fRgridspecs.entUMIN <Return> "load-translate-rotate-sort-draw"
bind .fRright.fRgridspecs.entUMIN <ButtonRelease-3> "load-translate-rotate-sort-draw"
bind .fRright.fRgridspecs.entUMAX <Return> "load-translate-rotate-sort-draw"
bind .fRright.fRgridspecs.entUMAX <ButtonRelease-3> "load-translate-rotate-sort-draw"
bind .fRright.fRgridspecs.entUSEGS <Return> "load-translate-rotate-sort-draw"
bind .fRright.fRgridspecs.entUSEGS <ButtonRelease-3> "load-translate-rotate-sort-draw"
bind .fRright.fRgridspecs.entVMIN <Return> "load-translate-rotate-sort-draw"
bind .fRright.fRgridspecs.entVMIN <ButtonRelease-3> "load-translate-rotate-sort-draw"
bind .fRright.fRgridspecs.entVMAX <Return> "load-translate-rotate-sort-draw"
bind .fRright.fRgridspecs.entVMAX <ButtonRelease-3> "load-translate-rotate-sort-draw"
bind .fRright.fRgridspecs.entVSEGS <Return> "load-translate-rotate-sort-draw"
bind .fRright.fRgridspecs.entVSEGS <ButtonRelease-3> "load-translate-rotate-sort-draw"
bind .fRright.fRviewparms.scaleLON <ButtonRelease-1> "rotate-sort-draw"
bind .fRright.fRviewparms.scaleLAT <ButtonRelease-1> "rotate-sort-draw"
bind .fRright.fRbuttons.radbuttFILL <ButtonRelease-1> "wrap_draw_2D_pixel_polys"
bind .fRright.fRbuttons.radbuttOUTLINE <ButtonRelease-1> "wrap_draw_2D_pixel_polys"
bind .fRright.fRbuttons.radbuttBOTH <ButtonRelease-1> "wrap_draw_2D_pixel_polys"
## Using <ButtonRelease-1> for redraws on changing the zoom
## causes the scale to 'go crazy' if you click in the trough.
## (Note that this was when the 'scaleZOOM' widget was packed with
## '-fill x -expand 1' and with a <Configure> binding on the canvas.)
## The sliderbar keeps advancing on its own and many redraws are done.
## The 'break' here does not help.
##
## So let us try a <Leave> binding instead. But we need something better.
## The user is going to tend to leave the mouse cursor over the
## scale and expect something to happen when he/she releases the button.
##
## <Leave> on a scale is weird. If you drag the slider bar, you DO
## need to leave to cause the redraw. But if you click in the trough,
## each click causes a redraw, as if the user leaves on each click
## of the trough. But it is one zoom value behind on each click ..
## i.e. the first click on the trough does not do anything.
# bind .fRleft.fRzoom.scaleZOOM <ButtonRelease-1> "wrap_draw_2D_pixel_polys;break"
bind .fRleft.fRzoom.scaleZOOM <ButtonRelease-1> "wrap_draw_2D_pixel_polys"
# bind .fRleft.fRzoom.scaleZOOM <Leave> "wrap_draw_2D_pixel_polys"
## If var curZOOM changes, do a redraw.
# trace add variable curZOOM write "wrap_draw_2D_pixel_polys"
##+##################################################################
##+##################################################################
## DEFINE PROCS SECTION:
##
## - 'listboxSelectionTOentryStrings' -
## Puts appropriate math expressions into the
## entry widget vars --- ENTRYfunction1,
## ENTRYfunction2, ENTRYfunction3 --- according to
## a user-selected surface-name in the listbox.
##
## - 'load_points_array' - (step1)
## For given functions of $u,$v in the 3 function
## entry fields, this proc builds a Tcl array of
## values of the form aRpoints($i,$j) = [list $x $y $z]
## where x,y,z are evaluated from the 3 user-specified functions
## of $u and $v --- and from the u,v grid that is generated
## from 6 u,v entry field values.
##
## While loading the aRpoints array, we find the min,max values of
## the xyz coords and use these to calculate midx,midy,midz values.
##
## - 'translate_points_array' - (step2)
## For the array aRpoints($i,$j) = [list $x $y $z],
## we calculate a new array in Cartesian coordinates:
## aRtranspoints($i,$j) = [list $transx $transy $transz]
## based at the midpoint of the min-max ranges of xyz.
##
## (Note that the xyz values could be far from the origin
## in 3-space --- 0,0,0. So we need to translate the 'center
## point' of the plot data to the middle of the data cloud.
## I.e. we may be rotating the data around a point far
## from the origin 0,0,0.)
##
## We could use the array 'aRpoints' to hold the translated
## coordinates, but we will use some memory just in case we
## find it useful to have the original point values available
## --- for example for coloring the polygons according to
## the original data values.
##
## - 'rotate_points' - (step3)
## For a given longitude and latitude (view direction),
## this proc loops thru all the POINTS, in array aRtranspoints,
## rotating each point according to the current 2 longitude
## and latitude angles --- angLON,angLAT --- and calculating
## the new Cartesian (xyz) coordinates. The xyz data for
## the 'new points' are put into a new array, 'aRnew_points'.
##
## Thus if we make a 'simple' change like fill or outline color,
## or change to wireframe mode from fill mode (changes that do
## not change the function, grid, or view direction),
## we do not have to go through a lot of mathematical
## calculations again. We can work off of the 'aRnew_points' array.
##
## We are using memory for 3 arrays --- aRpoints, aRtranspoints,
## and aRnew_points --- to give us some processing efficiency
## when we make changes that should not require sweeping through
## the grid and performing math calculations that we have already
## done once.
##
## Because the canvas area will usually be no more than about
## 900x900 pixels, and the smallest polygons we will want will
## be about 3 pixels across, we will probably break up the
## rectangular grid into no more than about 300x300 segments.
## This would mean we generally have no more than about
## 3x300x300 = 270,000 xyz coords per array. At about 8bytes per
## coord, this means about 8x270000 = 2.16 Megabytes per array.
## For 3 arrays, this is about 6.5 Megabytes for the 3 arrays.
## Since most computers nowadays will have at least 1 Gigabyte
## = 1,000 Megabytes of memory available if no more than the
## basic operating system tasks are running, this means that
## less than 1% of the free memory will be used by the 3 arrays.
##
## - 'sort_polyIDs_list' - (step 4)
## For poly ID's "$i,$j" (2 integers separated by a comma)
## in a Tcl list 'LISTpolyIDs', we generate a new list called
## 'sortedLISTpolyIDs' --- by sorting the polyIDs according
## to the z-depth of each poly. Uses the proc
## 'compare_2polyIDs_by_zdepth'. See comments in that proc
## for current details of the sort method.
##
## - 'compare_2polyIDs_by_zdepth'
## Used by a Tcl 'lsort' command in proc 'sort_polyIDs_list'
## in order to sort a list of polygon IDs according to the
## 'max' z-depth of the corners/vertices of the polygons.
## Input is a pair of polygon IDs of the form "$i,$j"
## as arguments. Output is 1 or -1.
##
## - 'draw_2D_pixel_polys' - (step5)
## For the current aRnew_points array, this proc maps
## the y,z values of the 4 corners of the quadrilaterals
## into pixels and the polygons are placed on the current
## Tk canvas area with 'create polygon' commands --- with
## the requested '-fill' and '-outline' options and the requested
## color values.
##
## The initial mapping of world-units to pixels is based on
## mapping the canvas dimensions into world-units of at least
## the diameter of the data cloud of x,y,z points.
##
## We use the Tcl list 'sortedLISTpolyIDs' to determine
## the order in which to issue the 'create polygon' commands.
##
## Zooming logic is located solely in this proc.
##
## Note that the procs that built the arrays aRpoints,
## aRtranspoints, and aRnew_points are all dealing with 'world
## coordinates'. 'draw_2D_pixel_polys' is the only proc
## dealing with pixel coordinates.
##
## - 'load-translate-rotate-sort-draw' -
## a proc that calls 5 procs:
## - load_points_array
## - translate_points_array
## - rotate_points
## - sort_polyIDs_list
## - draw_2D_pixel_polys
## and also shows the draw-time (millisecs).
##
## - 'rotate-sort-draw' -
## a proc that calls 2 procs:
## - rotate_points
## - sort_polyIDs_list
## - draw_2D_pixel_polys
## and also shows the draw-time (millisecs).
##
## - 'wrap_draw_2D_pixel_polys' -
## a proc that calls 1 proc:
## - draw_2D_pixel_polys
## and also shows the draw-time (millisecs).
##
## - 'update_status_label' - shows the draw-time (millsecs) in a label
##
## - 'set_polygon_color1' - sets fill color for the polygons
## - 'set_polygon_color2' - sets outline color for the polygons
## - 'set_background_color' - sets background (canvas) color
## - 'update_colors_label' - to color buttons and reset a colors label
##
## - 'popup_msg_var_scroll' - to show Help text (and perhaps other msgs)
##+#################################################################
## We set some 'universal' constants that will be used in the 'rotate_points'
## proc --- and may be used in the ENTRYfunction1,2,3 variables.
set pi [expr {4.0 * atan(1.0)}]
set twopi [expr { 2.0 * $pi }]
set pihalf [expr { $pi / 2.0 }]
# set minuspihalf [expr {-$pihalf}]
##+#####################################################################
## proc listboxSelectionTOentryStrings
##
## PURPOSE: For the selected listbox line (a surface name), puts the
## corresponding xyz expressions into the 3 ENTRYfunction vars.
##
## CALLED BY: binding on button1-release on the listbox
##+#####################################################################
proc listboxSelectionTOentryStrings {} {
global ENTRYfunction1 ENTRYfunction2 ENTRYfunction3 \
aRfunction1 aRfunction2 aRfunction3
set sel_index [ .fRleft.fRlistbox.listbox curselection ]
incr sel_index
if { $sel_index != "" } {
set ENTRYfunction1 "$aRfunction1($sel_index)"
set ENTRYfunction2 "$aRfunction2($sel_index)"
set ENTRYfunction3 "$aRfunction3($sel_index)"
} else {
return
}
## For convenience and speed, we go ahead and do the entire
## sequence for drawing the function on the canvas.
load-translate-rotate-sort-draw
}
## END of 'listboxSelectionTOentryStrings' proc
##+#####################################################################
## proc load_points_array
##
## PURPOSE: For a given 3 functions of $u,$v in the 3 function entry
## fields, this proc builds a Tcl array of values of the form
## aRpoints($i,$j) = [list $x $y $z]
## where x,y,z are evaluated from the user-specified functions
## at values u($i) and v($j) over a rectangular grid in uv space
## and the u,v grid is determined from 6 u,v entry field values
## --- min,max,segs for u and v.
##
## Storing the xyz points in an array can save some computing by
## avoiding re-computing x,y,z over the the grid everytime a
## redraw is triggered and the 3 functions and grid have not changed
## --- for example, every time a rotation angle changes.
## This is especially beneficial for a large grid and/or
## a lot of redraws.
##
## While loading the array aRpoints, we find the min,max values of
## the xyz coords and use these to calculate Xmid,Ymid,Zmid values.
##
## We also use the min,max values to compute a 'diam' for the
## 'point cloud'.
##
## We also create a list, 'LISTpolyIDs', consisting of entries
## "$i,$j" --- two integers separated by a comma --- for
## 0 <= i < Nusegs and 0 <= j < Nvsegs. The length of the
## list is Nusegs times Nvsegs --- the number of quadrilateral
## polygons in the grid.
##
## CALLED BY: proc 'load-translate-rotate-sort-draw' --- for example,
## in <Return> or button3-release bindings on the 3 function
## entry fields --- and in the GUI initialization section
## at the bottom of this script
##+#####################################################################
proc load_points_array {} {
global ENTRYfunction1 ENTRYfunction2 ENTRYfunction3 pi twopi pihalf\
ENTRYumin ENTRYumax ENTRYusegs ENTRYvmin ENTRYvmax ENTRYvsegs \
aRpoints minX maxX minY maxY minZ maxZ Xmid Ymid Zmid diam LISTpolyIDs
## Set the x and y grid-increment amounts, in world coords.
set lenu [expr {$ENTRYumax - $ENTRYumin}]
set lenv [expr {$ENTRYvmax - $ENTRYvmin}]
set DELu [expr {$lenu / double($ENTRYusegs)}]
set DELv [expr {$lenv / double($ENTRYvsegs)}]
##################################################################
## Start looping thru the rectangular grid over integers i,j.
## For each i,j:
## set coords x,y,z = f(u,v),g(u,v),h(u,v) --- coords of a 3D point
## on the surface that we are plotting --- and store the 3 coords
## in array aRpoints via aRpoints($i,$j).
## We also collect minX,maxX,minY,maxY,minZ,maxZ.
##
## We are following the advice of the 'Practical Programming in
## Tcl & Tk' book, 4th edition, by Welch,Jones,Hobbs on page 96:
## "If you have complex indices, use a comma to separate different
## parts of the index. If you use a space in an index instead,
## then you have a quoting problem."
###################################################################
set u $ENTRYumin
set v $ENTRYvmin
for {set j 0} {$j <= $ENTRYvsegs} {incr j} {
for {set i 0} {$i <= $ENTRYusegs} {incr i} {
## Evaluate x,y,z from f(u,v),g(u,v),h(u,v).
set x [eval expr {$ENTRYfunction1}]
set y [eval expr {$ENTRYfunction2}]
set z [eval expr {$ENTRYfunction3}]
## LOAD THE 'aRpoints' ARRAY.
set aRpoints($i,$j) [list $x $y $z]
## Set the minX,maxX,minY,maxY,minZ,maxZ values of the points.
## We use these values in the TESTING 'puts' statements below.
if {$i == 0 && $j == 0} {
set minX $x
set maxX $x
set minY $y
set maxY $y
set minZ $z
set maxZ $z
} else {
if {$x < $minX} {set minX $x}
if {$x > $maxX} {set maxX $x}
if {$y < $minY} {set minY $y}
if {$y > $maxY} {set maxY $y}
if {$z < $minZ} {set minZ $z}
if {$z > $maxZ} {set maxZ $z}
}
## END OF if {$i == 0 && $j == 0}
set u [expr {$u + $DELu}]
}
## END OF i loop
set v [expr {$v + $DELv}]
set u $ENTRYumin
}
## END OF j loop
## Get the mid-points of the x,y,z ranges.
set Xmid [expr {($maxX + $minX) / 2.0}]
set Ymid [expr {($maxY + $minY) / 2.0}]
set Zmid [expr {($maxZ + $minZ) / 2.0}]
## Calculate a diameter for our 'cloud' of data points.
set diam [expr {$maxX - $minX}]
set maxDeltaY [expr {$maxY - $minY}]
if {$maxDeltaY > $diam} {set diam $maxDeltaY}
set maxDeltaZ [expr {$maxZ - $minZ}]
if {$maxDeltaZ > $diam} {set diam $maxDeltaZ}
## Load the list of poly IDs.
set LISTpolyIDs {}
for {set j 0} {$j < $ENTRYvsegs} {incr j} {
for {set i 0} {$i < $ENTRYusegs} {incr i} {
lappend LISTpolyIDs "$i,$j"
}
## END OF i loop
}
## END OF j loop
## FOR TESTING:
# set NUMgridpts [expr {($ENTRYusegs + 1) * ($ENTRYvsegs + 1)}]
# puts "proc 'load_points_array' > $NUMgridpts grid points in array. Some loaded points:"
# puts " aRpoints(0,0): $aRpoints(0,0)"
# puts " aRpoints($ENTRYusegs,$ENTRYvsegs): $aRpoints($ENTRYusegs,$ENTRYvsegs)"
# puts "Extreme z-values of the loaded points:"
# puts " minX: $minX maxX: $maxX minY: $minY maxY: $maxY minZ: $minZ maxZ: $maxZ"
# puts "Middle values of the loaded points:"
# puts " Xmid: $Xmid Ymid: $Ymid Zmid: $Zmid"
# puts "Max Diameter of the loaded points - diam: $diam"
}
## END OF PROC load_points_array
##+#####################################################################
## proc translate_points_array
##
## PURPOSE: For the array aRpoints, each of whose entries look like
## aRpoints($i,$j) = [list $x $y $z],
## we calculate a new array in Cartesian coordinates:
## aRtranspoints($i,$j) = [list $transx $transy $transz]
## based at the midpoint of the min-max ranges of xyz.
##
## (Note that the xyz values could be far from the origin
## in 3-space --- 0,0,0. So we need to translate the 'center
## point' of the plot data to the middle of the data cloud.
## I.e. we may be rotating the data around a point far
## from the origin 0,0,0.)
##
## We could use the array 'aRpoints' to hold the translated
## coordinates, but we will use some memory just in case we
## find it useful to have the original point values available
## --- for example for coloring the polygons according to
## the original data values.
##
## CALLED BY: proc 'load-translate-rotate-sort-draw' --- for example,
## for <Return> or button3-release bindings on the 3 function
## entry fields --- and in the GUI initialization section
## at the bottom of this script
##+#####################################################################
proc translate_points_array {} {
global aRpoints aRtranspoints ENTRYusegs ENTRYvsegs Xmid Ymid Zmid
##################################################################
## Start looping thru the rectangular grid over integers i,j.
## For each i,j:
## get coords x,y,z from array 'aRpoints' , translate them
## to coordinates relative to Xmid,Ymid,Zmid.
## Put the translated values into array aRtranspoints such that
## aRtranspoints($i,$j) = [list $transx $transy $transz]
###################################################################
for {set j 0} {$j <= $ENTRYvsegs} {incr j} {
for {set i 0} {$i <= $ENTRYusegs} {incr i} {
## Get the xyz coords from aRpoints($i,$j).
foreach {x y z} $aRpoints($i,$j) {break}
## Translate the xyz coords to the mid-point of the data.
set transx [expr {$x - $Xmid}]
set transy [expr {$y - $Ymid}]
set transz [expr {$z - $Zmid}]
## HERE IS where we load array aRtranspoints.
set aRtranspoints($i,$j) [list $transx $transy $transz]
}
## END OF i loop
}
## END OF j loop
## FOR TESTING:
# puts "proc 'translate_points_array' > After i,j loop - some translated points :"
# puts "aRtranspoints(0,0): $aRtranspoints(0,0)"
# puts "aRtranspoints($ENTRYusegs,$ENTRYvsegs): $aRtranspoints($ENTRYusegs,$ENTRYvsegs)"
}
## END OF PROC translate_points_array
##+###################################################################################
## proc 'rotate_points'
##
## PURPOSE: For a given longitude and latitude (view direction),
## this proc loops thru all the POINTS, in array aRtranspoints,
## rotating each point according to the current 2 longitude
## and latitude angles --- angLON,angLAT --- and calculating
## the new Cartesian (xyz) coordinates. The xyz data for
## the 'new points' are put into a new array, 'aRnew_points'.
##
## Thus if we make a 'simple' change like fill or outline color,
## or change to wireframe mode from fill mode (changes that do
## not change the function, grid, or view direction),
## we do not have to go through a lot of mathematical
## calculations again. We can work off of this 'aRnew_points' array.
##
## We are using memory for 3 arrays --- aRpoints, aRtranspoints,
## and aRnew_points --- to give us some processing efficiency
## when we make changes that should not require sweeping through
## the grid and performing math calculations that we have already
## done once.
##
## CALLED BY: proc 'load-translate-rotate-sort-draw'
## or proc 'rotate-sort-draw' --- for example, for the
## <Return> or button3-release binding on the 3 function
## entry fields --- and in the GUI initialization section
## at the bottom of this script
##+#####################################################################
set radsPERdeg [expr { $twopi / 360 }]
proc rotate_points {} {
global radsPERdeg ENTRYusegs ENTRYvsegs aRtranspoints aRnew_points
## We could calculate new min,max values for use in the draw-pixels
## routine, but we don't.
## minnewX maxnewX minnewY maxnewY minnewZ maxnewZ
## Get the 2 rotation angles (in degrees).
set angLON [.fRright.fRviewparms.scaleLON get]
set angLAT [.fRright.fRviewparms.scaleLAT get]
## Convert the 2 rotation angles from degrees to radians.
set angLON [expr {$radsPERdeg * $angLON}]
set angLAT [expr {$radsPERdeg * $angLAT}]
## THIS IS THE STEP WE HAVE BEEN LEADING UP TO ---
## THE ACTUAL ROTATION OF EACH 3D POINT --- done via a
## Ry * Rz rotation matrix --- a product of a longitudinal rotation about
## the z-axis, followed by a latitudinal rotation about the y-axis.
##
## z| . (x,y,f(x,y))
## | .
## | . angLAT
## |___________________y
## / .
## / .
## / angLON .
## x /
##
## Referring to computer graphics notes such as 'Draft Lecture Notes:
## Computer Graphics for Engineers', by Victor Saouma, U. of Colorado,
## 2000, page 24:
## If we rotate a model/point around the z and then y axes,
## by angles 'thetaz' and 'thetay' resp., and if we let
## cz=cos(thetaz),sz=sin(thetaz),cy=cos(thetay),sy=sin(thetay),
## the product of the 2 rotation matrices is
##
## | cy 0 sy | | cz -sz 0 |
## Ry*Rz = | 0 1 0 | | sz cz 0 |
## | -sy 0 cy | | 0 0 1 |
##
## | cy*cz -cy*sz sy |
## = | sz cz 0 |
## | -sy*cz sy*sz cy |
##
## To reduce the number of math operations in rotating each point,
## we pre-compute the 4 products and denote them as
## cycz, cysz, sycz, sysz.
##
## Then
## newx = cycz * x - cysz * y + sy * z
## newy = sz * x + cz * y
## newz = -sycz * x + sysz * y + cy * z
## Note that 'thetaz' and 'thetay' (the amounts to rotate the points),
## are related to the view angles in our case.
##
## angLON (an angle in the xy plane) is the longitudinal view angle, and
## angLAT (ordinarily an angle from the xy plane toward the z axis) is
## what we are calling the latitudinal view angle.
##
## We let angLON be 'thetaz' and angLAT be 'thetay', up to the sign.
##
## For 'thetaz' and 'thetay', we adjust the view angles, as needed, by
## a negative sign to get an 'appropriate' rotation of the point cloud.
set cy [expr {cos($angLAT)}]
set sy [expr {sin($angLAT)}]
set cz [expr {cos(-$angLON)}]
set sz [expr {sin(-$angLON)}]
set cycz [expr {$cy * $cz}]
set cysz [expr {$cy * $sz}]
set sycz [expr {$sy * $cz}]
set sysz [expr {$sy * $sz}]
##################################################################
## Start looping thru the rectangular grid over integers i,j.
## For each i,j:
## - get coords transx,transy,transz from array 'aRtranspoints'
## - apply the rotation matrix RyRz to the point
## to calculate the new Cartesian coords newX,newY,newZ
## - store the values in the new-points array
## aRnew_points($i,$j) = [list $newX $newY $newZ]
###################################################################
for {set j 0} {$j <= $ENTRYvsegs} {incr j} {
for {set i 0} {$i <= $ENTRYusegs} {incr i} {
## Get the cartesian coords from aRtranspoints($i,$j).
foreach {transx transy transz} $aRtranspoints($i,$j) {break}
## Calc the new Cartesian coords using
## newx = cycz * x - cysz * y + sy * z
## newy = sz * x + cz * y
## newz = -sycz * x + sysz * y + cy * z
set newX [expr { ($cycz * $transx) - ($cysz * $transy) + ($sy * $transz) }]
set newY [expr { ($sz * $transx) + ($cz * $transy) }]
set newZ [expr { (-$sycz * $transx) + ($sysz * $transy) + ($cy * $transz) }]
## FOR TESTING:
# puts "proc 'rotate_points' > For POINT $i,$j, the new rotated-translated point is:"
# puts " newX: $newX newY: $newY newZ: $newZ"
## HERE IS where we load array aRnew_points.
set aRnew_points($i,$j) [list $newX $newY $newZ]
}
## END OF i loop
}
## END OF j loop
## FOR TESTING:
# puts "proc 'rotate_points' > After i,j loop - some roated points :"
# puts " aRnew_points(0,0): $aRnew_spoints(0,0)"
# puts " aRnew_points($ENTRYusegs,$ENTRYvsegs): $aRnew_points($ENTRYusegs,$ENTRYvsegs)"
}
## END OF PROC 'rotate_points'
##+#####################################################################
## proc sort_polyIDs_list
##
## PURPOSE: For poly ID's "$i,$j" (2 integers separated by a comma)
## in a Tcl list 'LISTpolyIDs', we generate a new list called
## 'sortedLISTpolyIDs' --- by sorting the polyIDs according
## to the current z-depth of each poly.
##
## (Actually, we use x-depth in our case, since we will be
## plotting y,z --- not x --- in the draw routine --- as we
## imagine looking along the x-axis to a 2D projection plane
## which is parallel to or identical to the yz plane.)
##
## This proc uses the proc 'compare_2polyIDs_by_zdepth'.
## See comments in that proc (below) for current details on
## the sort method.
##
## CALLED BY: proc 'load-translate-rotate-sort-draw'
## or proc 'rotate-sort-draw' --- for example, for the
## <Return> or button3-release binding on the 3 function
## entry fields --- and in the GUI initialization section
## at the bottom of this script
## See the BINDINGS section above.
##+#####################################################################
proc sort_polyIDs_list {} {
global LISTpolyIDs sortedLISTpolyIDs
set sortedLISTpolyIDs \
[lsort -command compare_2polyIDs_by_zdepth $LISTpolyIDs]
}
## END OF PROC 'sort_polyIDs_list'
##+################################################################
## proc compare_2polyIDs_by_zdepth
##
## PURPOSE: To be used by a Tcl 'lsort' command in order to sort
## a list of polygon IDs according to the 'max' z-depth
## of the corners/vertices of the specified polygons.
##
## (Actually, we use x-depth in our case, since we will be
## plotting y,z in the draw routine --- as we imagine
## looking along the x-axis to the 2D projection plane.
## So we need to use the x-coordinate of the points to
## determine the near-ness/far-ness of the points.)
##
## (Alternatively, we could use an average z-depth or
## the z-depth at just one of the vertices. If there is
## some processing advantage, without significant adverse
## viewing consequence, we could try an alternative method.)
##
## INPUT: Input is a pair of polygon IDs as arguments to this
## proc.
##
## OUTPUT: Output is passed by the 'return' statement.
##
## Output is 1 (one) if the first polygon ID is
## considered greater than the 2nd polygon ID, and
## -1 (minus one) otherwise.
##
## (If the z-depth/x-depth of the 2 polygons is the same,
## it does not matter much which one we choose to be
## the greater.)
##
## OTHER CONSIDERATIONS:
##
## In this application, we are working over
## a rectangular array of points in u,v parameter
## space and our list of polygon IDs is integer pairs
## of the form "$i,$j", where 0 <= i < Nusegs and
## 0 <= j < Nvsegs --- and the length of the list
## is Nusegs times Nvsegs.
##
## To use the pair of polygon IDs, we will need
## a 'points' array (translated and rotated).
##
## We need the 'points' array to determine the z/x-values
## of the 2xN points, where N is the number of vertices
## in each polygon --- in this application, N=4.
##
## In this implementation, we compare the max x-value of
## one set of 4 points to the max x-value of the other
## set of 4 points.
##
## REFERENCE: pages 70-71 on the 'lsort' command in the book
## 'Practical Programming in Tcl and Tk', 4th edition,
## by Welch, Jones, and Hobbs.
##
## CALLED BY: a Tcl command of the form
##
## set sortedLISTpolyIDs \
## [lsort -command compare_2polyIDs_by_zdepth $LISTpolyIDs]
##
## in proc 'sort_polyIDs_list'.
##+################################################################
proc compare_2polyIDs_by_zdepth {id1 id2} {
global aRnew_points
## Split id1 into its i and j parts.
set listID1 [split $id1 ,]
set iID1 [lindex $listID1 0]
set jID1 [lindex $listID1 1]
## Get the z-depths (x-depths) of the 4 vertices of the polygon at id1.
foreach {x1 dummy dummy} $aRnew_points($iID1,$jID1) {break}
foreach {x2 dummy dummy} $aRnew_points([expr {$iID1 + 1}],$jID1) {break}
foreach {x3 dummy dummy} $aRnew_points($iID1,[expr {$jID1 + 1}]) {break}
foreach {x4 dummy dummy} $aRnew_points([expr {$iID1 + 1}],[expr {$jID1 + 1}]) {break}
## Assure that the x's are considered floating point, not chars.
set x1 [expr {double($x1)}]
set x2 [expr {double($x2)}]
set x3 [expr {double($x3)}]
set x4 [expr {double($x4)}]
## Get the max z-depth (x-depth) of the polygon at id1.
set xdepthID1 [expr {max($x1,$x2,$x3,$x4)}]
## Split id2 into its i and j parts.
set listID2 [split $id2 ,]
set iID2 [lindex $listID2 0]
set jID2 [lindex $listID2 1]
## Get the z-depths (x-depths) of the 4 vertices of the polygon at id2.
foreach {x1 dummy dummy} $aRnew_points($iID2,$jID2) {break}
foreach {x2 dummy dummy} $aRnew_points([expr {$iID2 + 1}],$jID2) {break}
foreach {x3 dummy dummy} $aRnew_points($iID2,[expr {$jID2 + 1}]) {break}
foreach {x4 dummy dummy} $aRnew_points([expr {$iID2 + 1}],[expr {$jID2 + 1}]) {break}
## Assure that the x's are considered floating point, not chars.
set x1 [expr {double($x1)}]
set x2 [expr {double($x2)}]
set x3 [expr {double($x3)}]
set x4 [expr {double($x4)}]
## Get the max z-depth (x-depth) of the polygon at id2.
set xdepthID2 [expr {max($x1,$x2,$x3,$x4)}]
## Compare the 2 z-depths (x-depths) and return 1 or -1.
if {$xdepthID1 >= $xdepthID2} {
return 1
} else {
return -1
}
}
## END OF PROC 'compare_2polyIDs_by_zdepth'
##+###########################################################
## proc draw_2D_pixel_polys
##
## PURPOSE:
## For the data array aRnew_points($i,$j),
## we 'sweep' through the rectangular grid (using our list
## of depth-sorted polygon IDs, 'sortedLISTpolyIDs') plotting
## the polygons on the canvas with 'create polygon' commands.
##
## For our projection on a viewing plane:
## Rather than using the x,y coords of our rotated points (and
## ignoring the z coord), we use the y,z coords of our rotated
## points (and 'ignore' the x coord). I.e. we imagine looking
## at a 2D projection plane perpendicular to the x-axis.
##
## Recall that our 'global, fixed' positive z-axis is 'up',
## positive y is to the right, and positive x is out of the
## monitor surface.
##
## Then for longitude,latitude (0,0) --- where the x-axis is
## out of the screen (viewport), and longitude goes from 0 to
## 360 degrees from the x axis toward the y axis, and latitude
## goes from -90 to +90 degrees measured from the xy plane toward
## the z axis --- we get a 'front view' (i.e. points are projected
## into the yz plane).
##
## (0,90) gives us a 'top view' (a view perpendicular to the xy plane)
## and (90,0) gives us a 'side view' (a view perpendicular to the
## xz plane.
##
## We use our 'x-sort' to plot the 'farther-away' polygons first.
##
## We convert the y,z 2D points from 'world coordinate' units to
## pixel units within the current canvas dimensions --- based
## on the 'diameter of the point cloud' as determined in the
## proc 'load_points_array'. Then ...
##
## draw polygons using groups of 4 2D points at a time, and
## based on the fill/outline/both radiobuttons of the GUI and
## colors set by the color-buttons of the GUI.
##
## In addition, we use the curZOOM variable from the 'scaleZOOM'
## widget of the GUI to allow for zooming (by adjusting the
## 'diameter of the point cloud').
##
## INPUTS:
## All the global vars declared below.
##
## CALLED BY: proc 'load-translate-rotate-sort-draw'
## or proc 'rotate-sort-draw' --- for example, for the
## <Return> or button3-release binding on the 3 function
## entry fields --- and in the GUI initialization section
## at the bottom of this script --- and on any change
## to the fill/outline/both radiobuttons or by use of
## the color-buttons to make a color change.
## See the BINDINGS section above.
##+#########################################################
set TOLcheck 0.05
proc draw_2D_pixel_polys {} {
global aRnew_points sortedLISTpolyIDs ENTRYusegs ENTRYvsegs diam \
COLOR1hex COLOR2hex COLORbkGNDhex \
poly_filloutboth curZOOM \
COLOR1r COLOR1g COLOR1b minZ maxZ TOLcheck aRpoints
## The following could be used if we set min,max values
## for xyz in the 'rotate_points' proc. COMMENTED FOR NOW.
##
## Set the approximate diameter of the model (surface).
# set deltaX [expr {$maxnewX - $minnewX}]
# set deltaY [expr {$maxnewY - $minnewY}]
# set deltaZ [expr {$maxnewZ - $minnewZ}]
# set diam $deltaX
# if {$deltaY > $diam} {set diam $deltaY}
# if {$deltaZ > $diam} {set diam $deltaZ}
## BEFORE the loop to plot POLYGONS,
## we get the PIXELS-PER-WORLD-UNITS CONVERSION FACTOR,
## by dividing the minimum canvas dimension by
## $curZOOM times the model/surface diameter, where curZOOM
## is allowed to go from about 0.1 to 10.
## Get the current canvas size.
set curCanWidthPx [winfo width .fRright.fRcan.can]
set curCanHeightPx [winfo height .fRright.fRcan.can]
set minCanDimPx $curCanWidthPx
if {$curCanHeightPx < $minCanDimPx} {set minCanDimPx $curCanHeightPx}
## To preserve distances nicely, we want to use the same
## pixels-per-world-units factor in both x and y directions
## (assuming the pixels are square).
##
## Here, we may intialize curZOOM so that the rotated surface comfortably
## fits into the canvas --- that is, so that the 'plot' is 'set in' from
## the boundary of the canvas.
set PxPerUnit [expr { double( $minCanDimPx / ($curZOOM * $diam) ) }]
# set PxPerUnit [expr { double( ($curZOOM * $minCanDimPx) / $diam ) }]
## Get the half width and height of the canvas rectangle ---
## which serve as the pixel-coordinates of the (near?) center of the plot.
set imgWidthPx $curCanWidthPx
set imgHeightPx $curCanHeightPx
if {$imgWidthPx % 2 == 1} { incr imgWidthPx -1 }
if {$imgHeightPx % 2 == 1} { incr imgHeightPx -1 }
set xmidPx [expr {$imgWidthPx / 2}]
set ymidPx [expr {$imgHeightPx / 2}]
###############################################################
## Set the 'fill' and 'outline' parms that we will use with the
## 'create polygon' commands, in the 'create polygon' loop below.
###############################################################
if { "$poly_filloutboth" == "fill"} {
## For this case, the case of no wireframe on the surface,
## we use a technique like MM used --- to set the color of
## a polygon according to the value of the original z heights
## (average of z heights at the 4 corners), applied to the
## user-selected 'fill' color.
##
## See the loop below in which z1,z2,z3,z4 are extracted
## for each i,j position in the loop.
##
## Set some parms for that routine.
set deltaZ [expr {$maxZ - $minZ}]
set zeroTOL [expr {$TOLcheck * $diam}]
# set Low0to1 0.5
# set Low0to1 0.35
set Low0to1 0.25
# set Low0to1 0.15
# set Low0to1 0.0
if {$deltaZ < $zeroTOL} {
set deltaZ 0.0
} else {
set del0to1delZ [expr {(1.0 - $Low0to1)/$deltaZ}]
}
## The following color setting resulted in one 'blob' of
## solid color. Instead, we set the fill-only color within
## the i,j loop below.
# set COLORparms "-fill $COLOR1hex"
}
if { "$poly_filloutboth" == "outline" } {
## Without setting the fill to the background color,
## we get a wireframe image with no hiding of back polygons.
# set COLORparms "-outline $COLOR2hex"
set COLORparms "-outline $COLOR2hex -fill $COLORbkGNDhex"
}
if { "$poly_filloutboth" == "both" } {
set COLORparms "-outline $COLOR2hex -fill $COLOR1hex"
}
## Clear the canvas before starting to lay down the new polygons.
.fRright.fRcan.can delete all
##################################################################
## Start 'sweeping' over the rectangular u,v grid by using the
## list of depth-sorted polygon IDs, 'sortedLISTpolyIDs'.
## to 'paint' each quadrilateral polygon onto the canvas.
##
## For each 'polyID' (of the form "$i,$j", i.e. 2 integers separated
## by a comma):
##
## - convert the yz coords of array 'aRnew_points' to pixel coords,
## for i,j and i+1,j and i,j+1 and i+1,j+1.
##
## NOTE:
## Rather than store another array, in this case an array of
## pairs of pixel-integers indexed by i and j, we convert
## most points to pixel coords 4 times, because most points are
## used in 4 different polygons.
##
## Alternatively, we could sweep through the grid and convert
## each yz point to pixel coords, storing each pair of pixel
## values (integers) into an array 'aRpixels2D($i,$j)', say.
## Then we could sweep through that array and plot the
## projected quadrilaterals.
##
## - plot each 4-vertex polygon according to requested color settings
## and requested fill/outline setting (fill/outline/both).
##
###################################################################
set numPolys [llength $sortedLISTpolyIDs]
for {set k 0} {$k < $numPolys} {incr k} {
## Split $sortedLISTpolyIDs($k) into its i and j parts.
set listID [split [lindex $sortedLISTpolyIDs $k] ,]
set i [lindex $listID 0]
set j [lindex $listID 1]
## Get the cartesian coords of the 4 corners of the quadrilateral
## from aRnew_points($i,$j). We go 'around' the rectangle.
# foreach {x1 y1 z1} $aRnew_points($i,$j) {break}
# foreach {x2 y2 z2} $aRnew_points([expr {$i + 1}],$j) {break}
# foreach {x3 y3 z3} $aRnew_points([expr {$i + 1}],[expr {$j + 1}]) {break}
# foreach {x4 y4 z4} $aRnew_points($i,[expr {$j + 1}]) {break}
foreach {x1 y1 z1} $aRnew_points($i,$j) {break}
foreach {x2 y2 z2} $aRnew_points($i,[expr {$j + 1}]) {break}
foreach {x3 y3 z3} $aRnew_points([expr {$i + 1}],[expr {$j + 1}]) {break}
foreach {x4 y4 z4} $aRnew_points([expr {$i + 1}],$j) {break}
if { "$poly_filloutboth" == "fill"} {
if {$deltaZ == 0.0} {
set COLORparms "-fill $COLOR1hex"
} else {
## For the case of no wireframe on the surface and deltaZ > 0,
## we use a technique like MM used --- to set the color of
## a polygon according to the value of the original z heights
## (specifically, average z height at the 4 corners), applied
## to the user-selected 'fill' color. The steps are:
##
## 1) Compute the average of the four z coordinates.
## 2) Compute its "ratio" in the z (min, max) range, a float between
## 0 and 1.
## 3) Use this ratio to map the components of the 'fill' color ---
## COLOR1r COLOR1g COLOR1b --- into a fill color for the polygon.
foreach {origx1 origy1 origz1} $aRpoints($i,$j) {break}
foreach {origx2 origy2 origz2} $aRpoints([expr {$i + 1}],$j) {break}
foreach {origx3 origy3 origz3} $aRpoints([expr {$i + 1}],[expr {$j + 1}]) {break}
foreach {origx4 origy4 origz4} $aRpoints($i,[expr {$j + 1}]) {break}
set diffZ [expr {(($origz1+$origz2+$origz3+$origz4)/4.0) - $minZ}]
set zRatio [expr {($del0to1delZ * $diffZ) + $Low0to1}]
set newCOLOR1r [expr {int($zRatio * $COLOR1r)}]
if {$newCOLOR1r > 255} {set newCOLOR1r 255}
set newCOLOR1g [expr {int($zRatio * $COLOR1g)}]
if {$newCOLOR1g > 255} {set newCOLOR1g 255}
set newCOLOR1b [expr {int($zRatio * $COLOR1b)}]
if {$newCOLOR1b > 255} {set newCOLOR1b 255}
set newCOLOR1hex [format "#%02X%02X%02X" $newCOLOR1r $newCOLOR1g $newCOLOR1b]
## FOR TESTING:
# puts "proc 'draw_2D_pixel_polys' > i: $i j: $j newCOLOR1hex: $newCOLOR1hex"
# puts " newCOLOR1r: $newCOLOR1r newCOLOR1g: $newCOLOR1g newCOLOR1b: $newCOLOR1b"
# puts " z1: $z1 z2: $z2 z3: $z3 z4: $z4"
# puts " minZ: $minZ maxZ: $maxZ zRatio: $zRatio"
set COLORparms "-fill $newCOLOR1hex"
}
## END OF if {$deltaZ == 0.0}
}
## END OF if { "$poly_filloutboth" == "fill"}
## Convert the POLYGON vertex coordinates to pixel values, using the 'PxPerUnit'
## factor determined above. Then add $xmidPx or $ymidPx to account for the
## fact that aRnew_points world-coordinates are relative to (x,y,z)=(0,0,0),
## and (0,0,0) should be positioned in the middle of the canvas.
##
## Note: We are plotting the yz coords about the center of the canvas at
## ($xmidPx,$ymidPx). We are plotting the y coords in the x-direction
## of the canvas and the z coords in the y direction of the canvas.
##
## Note that the y-pixel coords are based at the top of the canvas, yet the
## world-coordinates are based at the bottom. We convert the z-world-coords
## (which have been translated to the middle of the point cloud)
## to pixels and then subtract from the canvas height.
set x1Px [expr { round( ($PxPerUnit * $y1) + $xmidPx ) }]
set y1Px [expr { round( $curCanHeightPx - (($PxPerUnit * $z1) + $ymidPx) ) }]
set x2Px [expr { round( ($PxPerUnit * $y2) + $xmidPx ) }]
set y2Px [expr { round( $curCanHeightPx - (($PxPerUnit * $z2) + $ymidPx) ) }]
set x3Px [expr { round( ($PxPerUnit * $y3) + $xmidPx ) }]
set y3Px [expr { round( $curCanHeightPx - (($PxPerUnit * $z3) + $ymidPx) ) }]
set x4Px [expr { round( ($PxPerUnit * $y4) + $xmidPx ) }]
set y4Px [expr { round( $curCanHeightPx - (($PxPerUnit * $z4) + $ymidPx) ) }]
## FOR TESTING:
# puts "proc 'draw_2D_pixel_polys' > In i,j loop - converted the vertex-points to pixel units"
# puts " for POLYGON $i,$j :"
# puts " x1Px: $x1Px y1Px: $y1Px x2Px: $x2Px y2Px: $y2Px"
# puts " x3Px: $x3Px y3Px: $y3Px x4Px: $x4Px y4Px: $y4Px"
## Set the string of xy point pairs to plot with
## the canvas 'create polygon' command.
set XYpairs "$x1Px $y1Px $x2Px $y2Px $x3Px $y3Px $x4Px $y4Px"
## FINALLY, we plot the polygon $i,$j on the canvas.
eval .fRright.fRcan.can create polygon $XYpairs \
$COLORparms -tags TAGpolygon
## We may find use for 'TAGpolygon', for example to delete
## all polygons but leave other canvas objects such as text
## (someday?) on the canvas.
## FOR TESTING: (slow down the drawing of the polygons)
# update
# after 50
}
## END OF k loop
}
## END OF proc 'draw_2D_pixel_polys'
##+################################################################
## proc load-translate-rotate-sort-draw
##
## PURPOSE: a proc that calls 5 procs:
## - load_points_array
## - translate_points_array
## - rotate_points
## - sort_polyIDs_list
## - draw_2D_pixel_polys
##
## CALLED BY: see BINDINGS section above.
##+################################################################
proc load-translate-rotate-sort-draw {} {
global t0
## Set the current time, for determining elapsed
## time for redrawing the 3D plot.
set t0 [clock milliseconds]
load_points_array
translate_points_array
rotate_points
sort_polyIDs_list
draw_2D_pixel_polys
update_status_label
}
## END OF proc 'load-translate-rotate-sort-draw'
##+################################################################
## proc rotate-sort-draw
##
## PURPOSE: a proc that calls 3 procs:
## - rotate_points
## - sort_polyIDs_list
## - draw_2D_pixel_polys
##
## CALLED BY: see BINDINGS section above.
##+################################################################
proc rotate-sort-draw {} {
global t0
## Set the current time, for determining elapsed
## time for redrawing the 3D plot.
set t0 [clock milliseconds]
rotate_points
sort_polyIDs_list
draw_2D_pixel_polys
update_status_label
}
## END OF proc 'rotate-sort-draw'
##+################################################################
## proc wrap_draw_2D_pixel_polys
##
## PURPOSE: a proc that calls the proc 'draw_2D_pixel_polys'
## and shows the millisecs that the redraw took.
##
## CALLED BY: see BINDINGS section above.
##+################################################################
proc wrap_draw_2D_pixel_polys {} {
global t0
## Set the current time, for determining elapsed
## time for redrawing the 3D plot.
set t0 [clock milliseconds]
draw_2D_pixel_polys
update_status_label
}
## END OF proc 'wrap_draw_2D_pixel_polys'
##+#####################################################################
## proc 'update_status_label'
##+#####################################################################
## PURPOSE: Updates the draw-time (millisecs) in the label widget
## '.fRright.fRviewparms.labelSTATUS'.
##
## ARGUMENTS: none
##
## CALLED BY: the 3 'wrapper' redraw-procs:
## - load-translate-rotate-sort-draw
## - rotate-sort-draw
## - wrap_draw_2D_pixel_polys
##+#####################################################################
proc update_status_label {} {
global numSurfaces t0
.fRright.fRviewparms.labelSTATUS configure -text "\
$numSurfaces surface-names are in the listbox. Select one or enter your own
expressions for x,y,z in terms of \$u and \$v, below.
You can change values for func-coeffs, grid, view, zoom.
** re-DRAW TIME: [expr {[clock milliseconds] - $t0}] millisecs elapsed" \
}
## END OF PROC 'update_status_label'
##+#####################################################################
## proc 'set_polygon_color1'
##+#####################################################################
## PURPOSE:
##
## This procedure is invoked to get an RGB triplet
## via 3 RGB slider bars on the FE Color Selector GUI.
##
## Uses that RGB value to set a 'fill' color.
##
## Arguments: none
##
## CALLED BY: .fRbuttons.buttCOLOR1 button
##+#####################################################################
proc set_polygon_color1 {} {
global COLOR1r COLOR1g COLOR1b COLOR1hex COLOR1r COLOR1g COLOR1b
# global feDIR_tkguis
## FOR TESTING:
# puts "COLOR1r: $COLOR1r"
# puts "COLOR1g: $COLOR1g"
# puts "COLOR1b: $COLOR1b"
set TEMPrgb [ exec \
./sho_colorvals_via_sliders3rgb.tk \
$COLOR1r $COLOR1g $COLOR1b]
# $feDIR_tkguis/sho_colorvals_via_sliders3rgb.tk \
## FOR TESTING:
# puts "TEMPrgb: $TEMPrgb"
if { "$TEMPrgb" == "" } { return }
scan $TEMPrgb "%s %s %s %s" r255 g255 b255 hexRGB
set COLOR1hex "#$hexRGB"
set COLOR1r $r255
set COLOR1g $g255
set COLOR1b $b255
## Set color of color1 button and update the colors label.
update_colors_label
## Redraw the geometry in the new fill color.
wrap_draw_2D_pixel_polys
}
## END OF proc 'set_polygon_color1'
##+#####################################################################
## proc 'set_polygon_color2'
##
##+#####################################################################
## PURPOSE:
##
## This procedure is invoked to get an RGB triplet
## via 3 RGB slider bars on the FE Color Selector GUI.
##
## Uses that RGB value to set an 'outline' color.
##
## Arguments: none
##
## CALLED BY: .fRbuttons.buttCOLOR2 button
##+#####################################################################
proc set_polygon_color2 {} {
global COLOR2r COLOR2g COLOR2b COLOR2hex COLOR2r COLOR2g COLOR2b
# global feDIR_tkguis
## FOR TESTING:
# puts "COLOR2r: $COLOR2r"
# puts "COLOR2g: $COLOR2g"
# puts "COLOR2b: $COLOR2b"
set TEMPrgb [ exec \
./sho_colorvals_via_sliders3rgb.tk \
$COLOR2r $COLOR2g $COLOR2b]
# $feDIR_tkguis/sho_colorvals_via_sliders3rgb.tk \
## FOR TESTING:
# puts "TEMPrgb: $TEMPrgb"
if { "$TEMPrgb" == "" } { return }
scan $TEMPrgb "%s %s %s %s" r255 g255 b255 hexRGB
set COLOR2hex "#$hexRGB"
set COLOR2r $r255
set COLOR2g $g255
set COLOR2b $b255
## Set color of color2 button and update the colors label.
update_colors_label
## Redraw the geometry in the new outline color.
wrap_draw_2D_pixel_polys
}
## END OF proc 'set_polygon_color2'
##+#####################################################################
## proc 'set_background_color'
##+#####################################################################
## PURPOSE:
##
## This procedure is invoked to get an RGB triplet
## via 3 RGB slider bars on the FE Color Selector GUI.
##
## Uses that RGB value to set the color of the canvas ---
## on which all the tagged items (polygons) lie.
##
## Arguments: none
##
## CALLED BY: .fRbuttons.buttCOLORbkGND button
##+#####################################################################
proc set_background_color {} {
global COLORbkGNDr COLORbkGNDg COLORbkGNDb COLORbkGNDhex
# global feDIR_tkguis
## FOR TESTING:
# puts "COLORbkGNDr: $COLORbkGNDr"
# puts "COLORbkGNDg: $COLORbkGNDb"
# puts "COLORbkGNDb: $COLORbkGNDb"
set TEMPrgb [ exec \
./sho_colorvals_via_sliders3rgb.tk \
$COLORbkGNDr $COLORbkGNDg $COLORbkGNDb]
# $feDIR_tkguis/sho_colorvals_via_sliders3rgb.tk \
## FOR TESTING:
# puts "TEMPrgb: $TEMPrgb"
if { "$TEMPrgb" == "" } { return }
scan $TEMPrgb "%s %s %s %s" r255 g255 b255 hexRGB
set COLORbkGNDhex "#$hexRGB"
set COLORbkGNDr $r255
set COLORbkGNDg $g255
set COLORbkGNDb $b255
## Set color of background-color button and update the colors label.
update_colors_label
## Set the color of the canvas.
.fRright.fRcan.can config -bg $COLORbkGNDhex
}
## END OF proc 'set_background_color'
##+#####################################################################
## proc 'update_colors_label'
##+#####################################################################
## PURPOSE:
## This procedure is invoked to update the text in a COLORS
## label widget, to show hex values of current color1, color2,
## and background-color settings.
##
## This proc also sets the background color of each of those 3 buttons
## to its current color --- and sets foreground color to a
## suitable black or white color, so that the label text is readable.
##
## Arguments: global color vars
##
## CALLED BY: 3 colors procs:
## 'set_polygon_color1'
## 'set_polygon_color2'
## 'set_background_color'
## and the additional-GUI-initialization section at
## the bottom of this script.
##+#####################################################################
proc update_colors_label {} {
global COLOR1hex COLOR2hex COLORbkGNDhex \
COLOR1r COLOR1g COLOR1b \
COLOR2r COLOR2g COLOR2b \
COLORbkGNDr COLORbkGNDg COLORbkGNDb
.fRright.fRbuttons.labelCOLORS configure -text "\
Poly-Fill-Color - $COLOR1hex
Poly-Outline-Color - $COLOR2hex
Background Color: $COLORbkGNDhex"
# set colorBREAK 300
set colorBREAK 250
.fRright.fRbuttons.buttCOLOR1 configure -bg $COLOR1hex
set sumCOLOR1 [expr {$COLOR1r + $COLOR1g + $COLOR1b}]
if {$sumCOLOR1 > $colorBREAK} {
.fRright.fRbuttons.buttCOLOR1 configure -fg "#000000"
} else {
.fRright.fRbuttons.buttCOLOR1 configure -fg "#f0f0f0"
}
.fRright.fRbuttons.buttCOLOR2 configure -bg $COLOR2hex
set sumCOLOR2 [expr {$COLOR2r + $COLOR2g + $COLOR2b}]
if {$sumCOLOR2 > $colorBREAK} {
.fRright.fRbuttons.buttCOLOR2 configure -fg "#000000"
} else {
.fRright.fRbuttons.buttCOLOR2 configure -fg "#f0f0f0"
}
.fRright.fRbuttons.buttCOLORbkGND configure -bg $COLORbkGNDhex
set sumCOLORbkgd [expr {$COLORbkGNDr + $COLORbkGNDg + $COLORbkGNDb}]
if {$sumCOLORbkgd > $colorBREAK} {
.fRright.fRbuttons.buttCOLORbkGND configure -fg #000000
} else {
.fRright.fRbuttons.buttCOLORbkGND configure -fg #f0f0f0
}
}
## END OF proc 'update_colors_label'
##+#############################################################
## proc ReDraw_if_canvas_resized
##
## CALLED BY: bind .fRright.fRcan.can <Configure>
## at bottom of this script.
##+#############################################################
proc ReDraw_if_canvas_resized {} {
global PREVcanWidthPx PREVcanHeightPx
set CURcanWidthPx [winfo width .fRright.fRcan.can]
set CURcanHeightPx [winfo height .fRright.fRcan.can]
if { $CURcanWidthPx != $PREVcanWidthPx ||
$CURcanHeightPx != $PREVcanHeightPx} {
wrap_draw_2D_pixel_polys
set PREVcanWidthPx $CURcanWidthPx
set PREVcanHeightPx $CURcanHeightPx
}
}
## END OF ReDraw_if_canvas_resized
##+########################################################################
## PROC 'popup_msg_var_scroll'
##+########################################################################
## PURPOSE: Report help or error conditions to the user.
## CALLED BY: 'help' button
##+########################################################################
## To have more control over the formatting of the message (esp.
## words per line), we use this 'toplevel-text' method,
## rather than the 'tk_dialog' method -- like on page 574 of the book
## by Hattie Schroeder & Mike Doyel,'Interactive Web Applications
## with Tcl/Tk', Appendix A "ED, the Tcl Code Editor".
##+########################################################################
proc popup_msg_var_scroll { VARtext } {
## global fontTEMP_varwidth #; Not needed. 'wish' makes this global.
## global env
# bell
# bell
#################################################
## Set VARwidth & VARheight from $VARtext.
#################################################
## To get VARheight,
## split at '\n' (newlines) and count 'lines'.
#################################################
set VARlist [ split $VARtext "\n" ]
## For testing:
# puts "VARlist: $VARlist"
set VARheight [ llength $VARlist ]
## For testing:
# puts "VARheight: $VARheight"
#################################################
## To get VARwidth,
## loop through the 'lines' getting length
## of each; save max.
#################################################
set VARwidth 0
#############################################
## LOOK AT EACH LINE IN THE LIST.
#############################################
foreach line $VARlist {
#############################################
## Get the length of the line.
#############################################
set LINEwidth [ string length $line ]
if { $LINEwidth > $VARwidth } {
set VARwidth $LINEwidth
}
}
## END OF foreach line $VARlist
## For testing:
# puts "VARwidth: $VARwidth"
###############################################################
## NOTE: VARwidth works for a fixed-width font used for the
## text widget ... BUT the programmer may need to be
## careful that the contents of VARtext are all
## countable characters by the 'string length' command.
###############################################################
#####################################
## SETUP 'TOP LEVEL' HELP WINDOW.
#####################################
catch {destroy .fRtopmsg}
toplevel .fRtopmsg
# wm geometry .fRtopmsg 600x400+100+50
wm geometry .fRtopmsg +100+50
wm title .fRtopmsg "Note"
# wm title .fRtopmsg "Note to $env(USER)"
wm iconname .fRtopmsg "Note"
#####################################
## In the frame '.fRtopmsg' -
## DEFINE THE TEXT WIDGET and
## its two scrollbars --- and
## DEFINE an OK BUTTON widget.
#####################################
text .fRtopmsg.text \
-wrap none \
-font fontTEMP_varwidth \
-width $VARwidth \
-height $VARheight \
-bg "#f0f0f0" \
-relief raised \
-bd 2 \
-yscrollcommand ".fRtopmsg.scrolly set" \
-xscrollcommand ".fRtopmsg.scrollx set"
scrollbar .fRtopmsg.scrolly \
-orient vertical \
-command ".fRtopmsg.text yview"
scrollbar .fRtopmsg.scrollx \
-orient horizontal \
-command ".fRtopmsg.text xview"
button .fRtopmsg.butt \
-text "OK" \
-font fontTEMP_varwidth \
-command "destroy .fRtopmsg"
###############################################
## PACK *ALL* the widgets in frame '.fRtopmsg'.
###############################################
## Pack the bottom button BEFORE the
## bottom x-scrollbar widget,
pack .fRtopmsg.butt \
-side bottom \
-anchor center \
-fill none \
-expand 0
## Pack the scrollbars BEFORE the text widget,
## so that the text does not monopolize the space.
pack .fRtopmsg.scrolly \
-side right \
-anchor center \
-fill y \
-expand 0
## DO NOT USE '-expand 1' HERE on the Y-scrollbar.
## THAT ALLOWS Y-SCROLLBAR TO EXPAND AND PUTS
## BLANK SPACE BETWEEN Y-SCROLLBAR & THE TEXT AREA.
pack .fRtopmsg.scrollx \
-side bottom \
-anchor center \
-fill x \
-expand 0
## DO NOT USE '-expand 1' HERE on the X-scrollbar.
## THAT KEEPS THE TEXT AREA FROM EXPANDING.
pack .fRtopmsg.text \
-side top \
-anchor center \
-fill both \
-expand 1
#####################################
## LOAD MSG INTO TEXT WIDGET.
#####################################
## .fRtopmsg.text delete 1.0 end
.fRtopmsg.text insert end $VARtext
.fRtopmsg.text configure -state disabled
}
## END OF PROC 'popup_msg_var_scroll'
set HELPtext "\
\ \ \ \ \ ** HELP for this 3D Parametric-Surface Generation-and-Examination Utility **
SELECTING/ENTERING A FUNCTION:
When the GUI comes up, you can use the listbox to select a
parametric-surface to plot, by a 'surface name'.
A MouseButton-1 (MB1) click-release on a 'surface name' will put
expressions in variables \$u and \$v into the 3 x,y,z function entry
fields. The functions will be immediately plotted in the canvas area.
Alternatively, you may enter 3 functions of \$u and \$v of your own
choosing in the 3 'function-entry-fields'. The main rule to
observe is to use '\$u' and '\$v' to represent u and v. And,
of course, you should compose a syntactically-correct math
expression that is to be evaluated at each u,v location on
a rectangular grid of u,v coordinates.
'\$pi', '\$twopi', and '\$pihalf' are defined in this utility.
You can use those variable names in the expressions when you
need the value of pi --- or two times pi --- or half of pi.
---
CHANGING FUNCTIONS (also called EXPRESSIONS) :
You can change coefficients in a function or change the formulation
of the function, in the entry fields. To re-plot the new function(s),
you can press the Enter key when all the entry fields are ready.
OR, to re-plot at any time, you can MB3-click-release on any of
the 'function-entry-fields'.
---
ALTERING THE GRID:
You can change the grid parameters --- umin,umax,u-segs,
vmin,vmax,v-segs --- by entering new values. To re-plot based
on the new grid, you can press the Enter key in any grid entry
field --- or to re-plot at any time, you can MB3-click-release
on any of the 'grid-entry-fields'.
Note that the min,max values of u and v can be left at -1.0 and
1.0. The coefficients of \$u and \$v in the 3 expressions can be
adjusted, instead.
---
CHANGING THE VIEW ANGLE:
You can use the two 'angle-scale' widgets to quickly change either
of a couple of rotation angles --- longitude or latitude.
An MB1-release of the slider on a angle-scale widget causes a replot.
You can simply keep clicking in the 'trough' of either scale
widget (to the left or right of the scale-button) to step through
a series of re-plots, varying an angle one degee per click-release.
Or you can hold MB1 down, when the mouse cursor is to the right or
left of the scale-button in the trough, to rapidly but rather
precisely change to a new angle of rotation. Releasing MB1 will
cause a re-plot at the new angle.
---
ZOOMING:
You can use the 'zoom-scale' widget to magnify or shrink the plot.
An MB1-release of the slider on the zoom-scale widget causes a replot.
Click-release in the 'trough' --- on either side of the scale's button ---
to zoom in/out a little at a time.
---
FILL/OUTLINE/BOTH:
The fill/outline/both radiobuttons allow for showing the plot
with the polygons (quadrilaterals) color-filled or not --- and
with outlines ('wireframe' mode) or not.
---
COLOR:
Three COLOR BUTTONS on the GUI allow for specifying a color for
- the interior of the polygons
- the outline of the polygons
- the (canvas) background
from among 16 million colors, each.
---
Summary of 'EVENTS' that cause a 'REDRAW' of the plot:
Pressing Enter/Return key when focus is in one of the 3 'function-entry-fields'.
Alternatively, a button3-release in a 'function-entry-field'.
Pressing Enter/Return key when focus is in the
- 'umin' entry field
- 'umax' entry field
- 'u-segs' entry field
- 'vmin' entry field
- 'vmax' entry field
- 'v-segs' entry field
Alternatively, a button3-release in any of the 'grid-entry-fields'.
Button1-release on the LONGITUDE or LATITUDE scale widget.
Button1-release on the ZOOM scale widget.
Button1-release on the FILL or OUTLINE or BOTH radio-buttons.
Changing color via the FILL or OUTLINE color buttons.
ALSO: Resizing the window changes the size of the canvas,
which triggers a redraw of the plot according to the new
canvas size.
---
SOME POTENTIAL ENHANCEMENTS:
Eventually some other features may be added to this utility:
- the ability to pan the plot, as well as rotate and zoom it.
- the ability to use mouse motions on the canvas to rotate,
zoom, and pan the plot --- say, MB1 to rotate, MB2 to zoom,
and MB3 to pan the surface plot.
- an option to vary the color of the filled polygons may be
added --- say, by choosing polygon color according to the
average of y or z or x at the corners of each polygon
--- i.e. according to a 'y-height', 'z-height', or 'x-height'.
- more polygon-color assignment options may be added --- so
that the user can have colors added to polygon vertices
or polygons --- to 'liven up' the surface plot.
For example, options to assign random colors
or rainbow colors to the points/polygons may be added.
- an option to shade the polygons may be added --- to change
the color of the polygon faces according to the angle
that they make with a light source. (Initially we may
assume that the light source is coming from the viewer.
But eventually we may add the ability to specify
a different, arbitrary direction of the light source.)
- more parametric-surface names (and corresponding functions
to give x, y, and z in terms of \$u and \$v) may be added
to the listbox.
- depth clipping may be added --- so that the user
can essentially get section views of the surface.
- a 'triad' may be added, to show the orientation of the
xyz axes in any (re)plot.
- a check-button may be added to allow for switching to a
'perspective' view, from the current 'parallel projection'.
- a check-button may be added to allow for 'backface culling',
to speed up the plots when lots of polygons are not
facing the viewer and perhaps would be hidden ---
for example, polygons on the back-side of a sphere or
torus or cylinder.
- some changes to the sorting algorithm, by 'z-depth' of the
polygons, may need to be made --- to allow for (perhaps?)
better showing/hiding of near and far polygons.
- more elaborate shading techniques may eventually be
implemented --- like Gouraud --- to get smoother shading
effects across polygon edges, and perhaps to get glossy
effects. (These effects may be easiest to implement
by using colors assigned to polygon vertex points
rather than colors assigned to polygons.)
This would really slow each plot down, but having the
option might be worth it, to get a higher quality image ---
if it can be done within 10 to 30 seconds for a 40x40 grid.
(Unfortunately, there is no Gouraud option built into
the Tk 'create polygon' command for the canvas.
I would like to suggest this for Tk 9.0.)
- the list may go on."
##+######################################################
## End of PROC definitions.
##+######################################################
## Additional GUI INITIALIZATION:
## - Draw an intially-provided set of surface functions
## --- f(u,v) , g(u,v) , h(u,v) --- on the canvas,
## so that there is an example to see on the canvas.
##+######################################################
## Set an initial functions in the 3 function-entry-fields,
## so that the GUI has an example to display immediately.
if {0} {
## For a cylinder:
set ENTRYfunction1 {1.0 * cos($pi * $u)}
set ENTRYfunction2 {1.0 * sin($pi * $u)}
set ENTRYfunction3 {$v}
}
if {1} {
## For a sphere/ellipsoid:
set ENTRYfunction1 {1.0 * cos($pi * $u) * cos($pihalf * $v)}
set ENTRYfunction2 {1.0 * sin($pi * $u) * cos($pihalf * $v)}
set ENTRYfunction3 {1.0 * sin($pihalf * $v)}
}
if {0} {
## For a cone-frustrum:
set ENTRYfunction1 {($v + 2.0) * cos($pi * $u)}
set ENTRYfunction2 {($v + 2.0) * sin($pi * $u)}
set ENTRYfunction3 {$v}
}
## Set umin,umax,Nusegs,vmin,vmax,Nvsegs values suitable
## to the initial function chosen.
set ENTRYumin "-1."
set ENTRYumax "1."
set ENTRYusegs 40
set ENTRYvmin "-1."
set ENTRYvmax "1."
set ENTRYvsegs 40
## We set the initial value for this 'scaleZOOM' widget
## so that there will probably be a nice margin around the
## initial plot.
set curZOOM 1.1
# set curZOOM 1.4
# set curZOOM 1.5
## Set an initial value for the 3 radiobutton widgets for
## fill/outline/both.
set poly_filloutboth "both"
## Set the initial values for the 2 scale widgets
## that set the initial rotation angles
## (longitude and latitude).
##
## NOTE: Using the '-variable' option of the
## 'scale' widget can cause unwanted 'auto-repeat'
## behavior of the widget, so we do NOT specify
## variables. We use 'set' and 'get' instead.
if {0} {
## Start out looking at a FRONT VIEW of the model/surface.
.fRright.fRviewparms.scaleLON set 0
.fRright.fRviewparms.scaleLAT set 0
}
if {0} {
## Start out looking at a BACK VIEW of the model/surface.
.fRright.fRviewparms.scaleLON set 180
.fRright.fRviewparms.scaleLAT set 0
}
if {1} {
## Start out looking at an 'ISOMETRIC' VIEW of the model/surface.
.fRright.fRviewparms.scaleLON set 45
.fRright.fRviewparms.scaleLAT set 45
}
if {0} {
## Start out looking at a RIGHT-SIDE VIEW of the model/surface.
.fRright.fRviewparms.scaleLON set 90
.fRright.fRviewparms.scaleLAT set 0
}
if {0} {
## Start out looking at a LEFT-SIDE VIEW of the model/surface.
.fRright.fRviewparms.scaleLON set 270
.fRright.fRviewparms.scaleLAT set 0
}
if {0} {
## Start out looking at a TOP VIEW of the model/surface.
.fRright.fRviewparms.scaleLON set 0
.fRright.fRviewparms.scaleLAT set 90
}
if {0} {
## Start out looking at a BOTTOM VIEW of the model/surface.
.fRright.fRviewparms.scaleLON set 0
.fRright.fRviewparms.scaleLAT set -90
}
## We need following command because the 'draw_2D_pixel_polys' proc
## (called below) does not (re)set the background/canvas color.
## Only the background-color button-proc sets the canvas color.
.fRright.fRcan.can config -bg $COLORbkGNDhex
## We need following command because the 'draw_2D_pixel_polys' proc
## does not call the 'update_colors_label' proc to
## set the color of the color buttons and put
## the hex color values in the colors label.
## Only the color button procs call the 'update_colors_label' proc.
update_colors_label
## Rather than recompute the xyz values over the rectangular
## grid of uv points every time we view the plot from a
## different angle (or make other changes that do not change
## xyz values or uv-grid), we load the values into an array 'aRpoints'.
## Uses
## - functions in the 3 function-entry fields
## - grid-creation settings (6 u,v parms).
load_points_array
## Convert the array 'aRpoints' to Cartesian coords in array 'aRtranspoints'.
## Translates the points so they are centered at the middle of the data.
translate_points_array
## Rotate the 'aRtranspoints' points and convert to Cartesian coords that
## are stored in array 'aRnew_points'.
## Uses view angles (longitude,latitude).
rotate_points
## Sort the polyIDs according to the 'z-depth' of each poly.
## (We actually use the x-depth of each poly.)
##
## A Tcl list called 'LISTpolyIDs' was created in the
## 'load_points_array' proc.
## The poly ID's are of the form "$i,$j" (2 integers separated by
## a comma). From the list 'LISTpolyIDs', we generate a new list
## called 'sortedLISTpolyIDs'.
sort_polyIDs_list
## Using the list 'sortedLISTpolyIDs', we 'sweep'
## thru the array 'aRnew_points' converting the yz coords
## (the 2D projection) to pixel coords, and plot the
## polygons with the 'create polygon' command.
##
## We do an 'update' command to force an initial packing of
## the GUI so that an initial canvas size is set.
## 'draw_2D_pixel_polys' queries the current canvas size to fit the
## projection points into the canvas.
##
## See the 'bind <Configure>' command below. It handles
## automatic redraws whenever the user changes the
## window size, and thus the canvas size.
##
## 'draw_2D_pixel_polys' uses
## - fill, outline, and zoom settings
## - color settings.
update
draw_2D_pixel_polys
## From now on, if the canvas is resized, we do an automatic redraw
## via the 'wrap_draw_2D_pixel_polys' proc.
set PREVcanWidthPx [winfo width .fRright.fRcan.can]
set PREVcanHeightPx [winfo height .fRright.fRcan.can]
bind .fRright.fRcan.can <Configure> "ReDraw_if_canvas_resized"
##+#######################################################################
## ****
## NOTE: If a new parametric-surface-name is to be added to the listbox:
## ****
##
## The user can edit this script and add a 'parametric-surface-name'
## and 3 corresponding xyz expressions in array-setting statements
## near the 'listbox' statement that defines the listbox widget.
##
## Note that, for each name added, the corresponding 3 expressions for
## x,y,z will need to be added --- for use by the proc
## 'listboxSelectionTOentryStrings' in the PROCS section.
##
##+######################################################################
Besides generating 'closed' surfaces with this utility, you can also use it to generate the same 'open' surfaces as the f(x,y) utility did. In that utility, you entered a single function with variables $x and $y, to provide the z values.
You can enter those same functions in this utility --- just use the following 3 expressions to provide x, y, and z:
- u
- v
- f(u,v)
Here is an example.
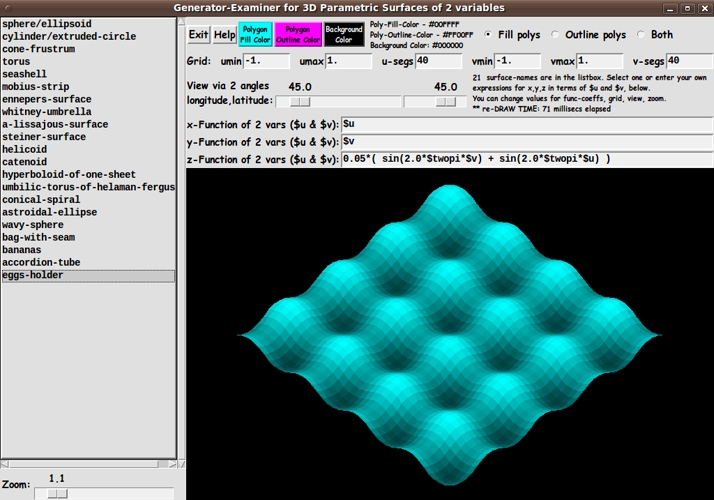
Note the '$u' and '$v' in the first 2 of the 3 function entry fields.
---
The following image shows that you can 'go bananas' with this utility.
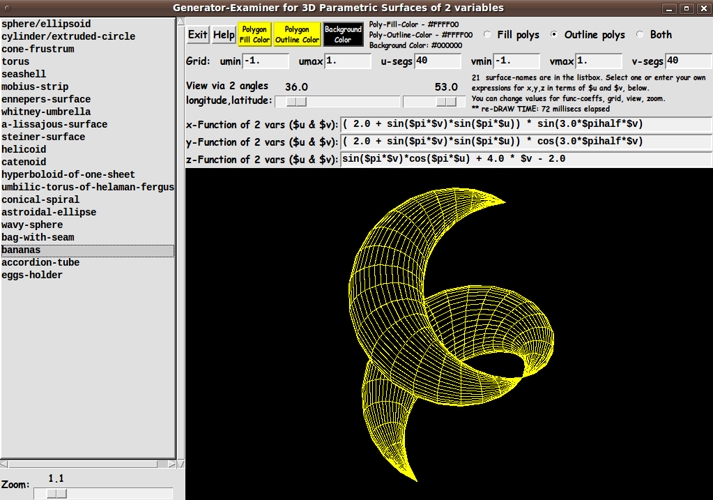
This shows the type of plot you get when you use the 'Outline polys' radiobutton.
Note that wireframe outlines of hidden polygons do not show --- i.e. this is a hidden-line plot of the wireframe.
We could add an additional radiobutton that allows for showing the wireframe with no lines hidden. This would simply be a matter of using only the '-outline' parameter on the 'create polygon' command, instead of using both '-outline' and '-fill', with the fill color set to the background color.
FILL ONLY
When the user chooses the 'fill-only' (no outlines) radiobutton, the plot would look like a blob of solid color, if all the polygons were painted the same fill color.
You can emulate this by setting both the outline color and the fill color to the same color and using the 'both' radiobutton.
To avoid this color-blob, the 'draw_2D_pixel_polys' proc provides gradation of the fill color of polygons according to the average (original) z-height of each polygon.
The 'eggs-holder' surface plot above is an example of the shaded result.
This is a somewhat 'expensive' operation. The draw times go up a factor of at least 50% --- over the use of the 'outline' or 'both' radiobutton options, which do not shade the polygons.
(Note: The color assignment according to z-height can no doubt be improved. This was just a first attempt. If it turns out that the 'format' command is eating up most of the time, I can probably get a big improvement by using an index into a table of about 20 colors, instead of using 'format'. Also, I can get some improvement during rotation of the model by computing the 4-vertex-average z-height of the polygons just one time, in the 'load_points_array' proc, for a given function and grid --- and storing the averages in an array for repeated use, for example, during rotations. I.e. gain some speed at the cost of some memory. I will probably return to this issue someday and provide a significantly faster z-height-color-assignment routine --- or some other polygon-shading method.)
SOME POTENTIAL ENHANCEMENTS:
Eventually some other features may be added to this utility:
- the ability to pan the plot, as well as rotate and zoom it.
- the ability to use mouse motions on the canvas to rotate, zoom, and pan the plot --- say, MB1 to rotate, MB2 to zoom, and MB3 to pan the surface plot.
- more options to vary the color of the filled polygons may be added --- say, by allowing the user to choose polygon color shading according to the original 'x-height' or 'y-height' --- in addition to the current default of varying the polygon 'fill-only' colors according to the original 'z height'. OR, the x-depth that was used to sort the polygons could be used to shade the user-selected polygon color --- darker for greater x-depth.
- more polygon-color assignment options may be added --- so that the user can have colors added to polygon vertices or polygons --- to 'liven up' the surface plot. For example, options to assign random colors or rainbow colors to the points/facets may be added.
For example, displays like the following could be rendered.
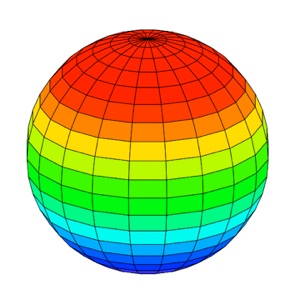
- an option to 'light shade' the polygons may be added --- to change the color of the polygon faces according to the angle that they make with a light source. (Initially we may assume that the light source is coming from the viewer. But eventually we may add the ability to specify a different, arbitrary direction of the light source.)
- more surface-names (and corresponding function triplets) may be added to the listbox.
- depth clipping may be added --- so that the user can essentially get section views of the surface.
- a 'triad' may be added to show the orientation of the surface's ('local') xyz axes in any (re)plot.
- a 'Write OBJ file' button may be added, to write out an ASCII 3D model file (xyz points records and polygon 'connectivity' records) for a given u,v-grid and a given triplet of parametric functions in u,v
- a checkbutton (or radiobuttons) may be added to support generating either an all-triangles or an all-quads mesh. Using triangles may help handle 'artifacts' that appear in display of some self-intersecting surfaces. The artifacts would probably be reduced by using triangles instead of quads. However, several of the procs in the sequence of 5 draw procs would have to be enlarged quite a bit to handle both tri-mesh and quad-mesh. Perhaps making a separate script for a tri-mesh approach is a better way to go.
- a check-button may be added to allow for switching to a 'perspective' view, from the current 'parallel projection'.
- a check-button may be added to allow for 'backface culling', to speed up the plots when lots of polygons are not facing the viewer and perhaps would be hidden --- for example, polygons on the back-side of a sphere or torus or cylinder.
- sorting according to a different 'z-depth' measure of the polygons could be offered --- to allow for (perhaps?) better showing/hiding of near and far polygons.
- more elaborate shading techniques may eventually be implemented --- like Gouraud --- to get smoother shading effects across polygon edges, and perhaps to get glossy effects. (These effects may be easiest to implement by using colors assigned to polygon vertex points rather than colors assigned to polygons.)
This would really slow each plot down, but having the option might be worth it, to get a higher quality image --- if it can be done within 10 to 30 seconds for a 40x40 grid.
(Unfortunately, there is no Gouraud-like color-interpolation-across-a-polygon option built into the Tk 'create polygon' command for the canvas. I would like to suggest this for Tk 9.0 --- at least in the case when the polygons are triangles --- allow for specifying a different color at each of the 3 vertices.)
I may add a few more ideas for enhancements to this Tk script in coming months, as I tackle other 3D utilities.
THE MILLISECONDS DISPLAY
Like in the f(x,y) version of this utility, this script displays the milliseconds elapsed to do each redraw --- to help get an idea of whether the 'model' (data-surface or data-cloud) can be rotated smoothly via mouse motions on the canvas.
The milliseconds are displayed in the label widget to the right of the longitude-latitude scale widgets.
If we can do redraws in about 50 milliseconds (corresponding to a 'frame rate' of 20 frames per second), we should be able to rotate the data cloud rather smoothly.
Unfortunately, for this u,v-parametric-surface utility, it turns out that a 40x40 data grid was re-drawing at around 300 milliseconds on my computer --- whereas redraws of a similar sized grid typically occurred in about 70 milliseconds for the f(x,y) version of this utility.
Not surprisingly, an 80x80 data grid was taking about 3 to 4 times as long for a re-draw --- around one second.
I have not taken the time yet to investigate in which of the 5 'graphics pipeline' procs most of the time is being spent. Perhaps others can help in this regard. I certainly do not know the internals of Tcl-Tk well enough to spot areas where significant gains can be made.
No doubt, there are some ways to change the calculations and/or procedures to get a significant speed up of the redraws and thus allow for smooth rotation of large grids.
If this script is enhanced to allow for 'immediate' rotation according to mouse motion on the canvas, then the rotation will definitely be a bit 'jumpy' --- even for 'small' grids on the order of 30x30. So it behooves one to find ways to speed up the draw procs.
SCALES RESPONSE
'-repeatdelay 500' and '-repeatinterval 50' parameters are present on all three scales. If the responsiveness of the sliderbar movements is not to your liking (when you press-and-hold mouse-button-1 over a scale's trough --- to rapidly make changes of about 5 to 10 degrees in a view angle), you can change these milliseconds values.
MORE SURFACES
I intially provided about 20 function-triplets via the surface-names listbox.
I could add some sombrero-like surfaces, from the f(x,y) utility, by providing the 3 u,v functions: $u, $v, f($u,$v) --- where f($u,$v) is the sombrero function f($x,$y) but with $x and $y replaced by $u and $v.
Furthermore, there are a literally unlimited number of triplets of functions that could be added for 'surfaces of revolution' and 'extruded', 'lofted', and 'ruled' surfaces.
And you can do like I did --- do an internet search on terms like 'parametric surface 3d' --- to find more examples to add.
NEXT 3D PROJECTS
The development of the polygon-depth-sort proc for this script will be very useful to me. That proc, and the other procs in this script, will be useful for other 3D Tk-script projects --- such as generation-and-viewing of terrain surfaces and reading-and-examining 3D model files.
However, I will need to make some changes to handle triangular polygons and polygons of essentially any number of sides.
SIMILAR SOFTWARE
I ran across an image of the 'SurfX3D' GUI that is very similar to the GUI of the script presented on this page.
You can see that this GUI allows for setting some 'sub-expressions' (of u and v) that are used in the main expressions.
This reminds me that I may provide one or more entry fields someday for 'pre-setting' some parameters via expressions (not involving u or v) --- so that those expressions do not have to be calculated repeatedly in the surface calculation loops (u loop inside a v loop).
You can see near the bottom of the GUI that it provides entry fields for a couple of viewing angles called 'Z rotate' and 'XY Tilt' --- apparently analogous to the 'longitude' (yaw) and 'latitude' (pitch) angles, respectively, of this Tk GUI.
It is not clear if you can change viewing angle as quickly with SurfX3D as you can with this Tk GUI.
Similarly, there is an entry field for 'Overall Scale %' --- apparently analogous to the 'zoom' scale-widget option of this Tk GUI.
It is not clear if you can change 'scale %' as quickly with SurfX3D as you can with this Tk GUI.
But one thing is for sure. You can check this Tk GUI code to make sure there is not 'ad-ware', 'spy-ware', or other 'bloat-ware' in this code.
Nicely, SurfX3D is freeware --- and so is this script.
The bang-per-buck ratio of both is infinity. Combine that with open source (i.e. the ability to modify, enhance, and fix the Tk script) and you have programmer's heaven. (Sounds like the name of a web site that I have seen.)
In other words, you can add more bang for still zero bucks and you get a larger infinity --- from the new, bigger-numerator bang-per-buck ratio.
To infinity and beyond! Thank you, Tcl-Tk.
arjen - 2013-01-03 13:56:16
When I try to change the colour of this otherwise fascinating program, I get a message about the program ./sho_colorvals_via_sliders3rgb.tk not being found.
uniquename 2013jan03
See the comment at the bottom of the 'Experimenting with the GUI' section above.
arjen Ah, missed that - thank you.
stevenaaus - Seems busted to me. This code is working though - https://wiki.tcl-lang.org/37451