Analyzing Remote Sensing Data with NAP
NB (05/07/07), Arjen Markus's post on Analyzing geographical data with NAP prompted me to get off my duff and add some of the ways we are using NAP for raster analysis.
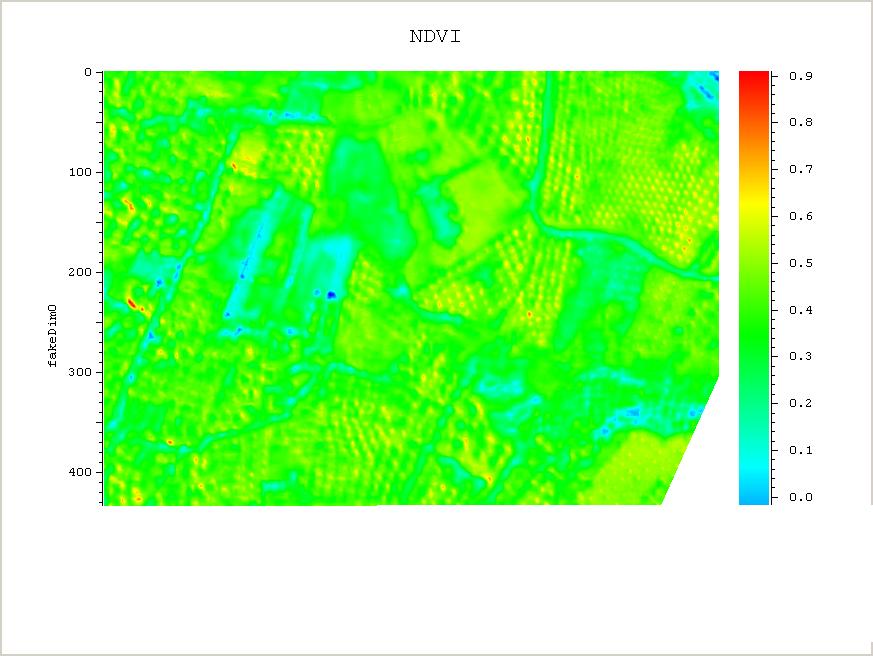
The example below shows how one can do vegetation analysis, Normalized Difference Vegetation Index (NDVI), using raster maps, which gives an indication of how much green vegetation is present in the photos.
 ####Using ESRI ascii grids as inputs...

 nap "red = get_gridascii('red.ASC')";

 nap "near = get_gridascii('near.ASC')";

 nap_info seconds

 nap "NDVI = (near-red)/(near+red)"

 nap_info seconds

 ###Plot output to a jpeg file

 plot_nao NDVI -print 1 -filename NDVI_asc.jpeg

 ###Ascii grids seem slower to parse, so let us use HDF files

 nap "red = f32 "[nap_get hdf red.hdf "3-dimensional Scientific Dataset"]""

 $red shape
 nap "near = f32 [nap_get hdf near.hdf "3-dimensional Scientific Dataset"]"

 nap "NDVI = (near-red)/(near+red)"

 #nap_info seconds

 ###sanity check, NDVI NAO should have same shape as red or near NAO

 $NDVI shape

 plot_nao NDVI(,,0)

 ########Another approach, using a multi-band hdf, derived from a multiband geotiff using GDAL,

 nap "all_bands = f32 [nap_get hdf all_bands.hdf "3-dimensional Scientific Dataset"]"

 nap "red = all_bands(,,1)"

 nap "near = all_bands(,,3)"

 nap "NDVI = (near-red)/(near+red)"

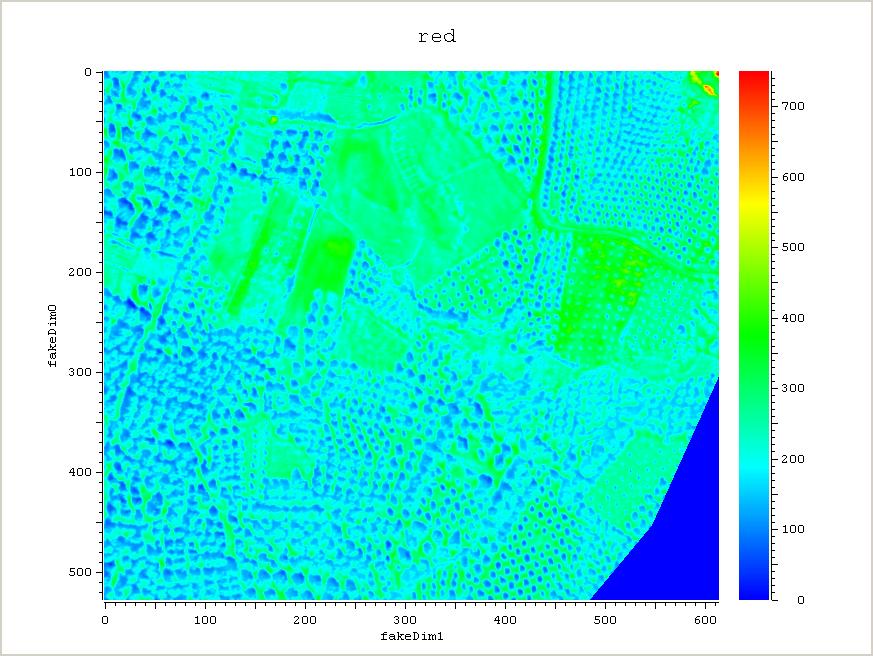
 plot_nao red -print 1 -filename red.jpg

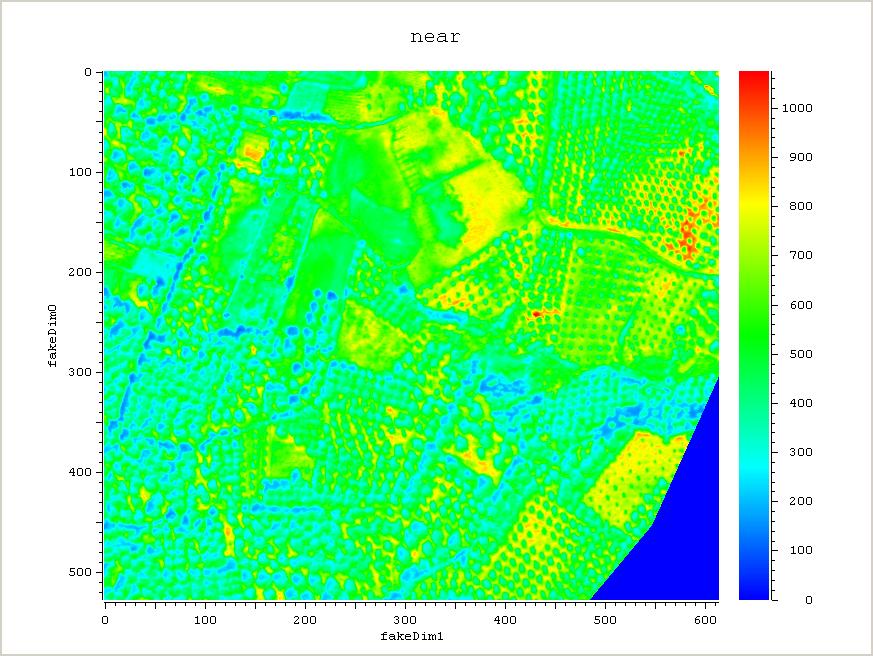
 plot_nao near -print 1 -filename near.jpg

 plot_nao NDVI -print 1 -filename NDVI.jpg
Here are the pictures: