Data and text and graphics all together
Arjen Markus I was reminded of experiments with a mathematical notebook I did years ago, when I saw an application in "R". The application presents a document with embedded graphics and the data used for the graphs. You can change the plot parameters interactively. While the program below is not as sophisticated as all that (no interactivity), it does combine the data with the plots and the code used for the plots with the text explaining what is all about. The capabilities are currently limited, but then I only spent the better part of an evening coding it.
Also see Jupyter[L1 ] which includes kernel for TCL along with many other languages.
Here is the code:
# datadoc.tcl --
#     Demonstration of how to integrate text and data in a single document.
#

# work --
#     Set up the namespace in which to run the code fragments
#
#     Note: this namespace is used to run all code in
#
namespace eval work {}

# code --
#     Procedure to run a body of code
#
# Arguments:
#     code      The actual code to run
#
proc ::work::code {code} {
    namespace eval [namespace current] $code
}

# canvas --
#     Procedure to set up an embedded canvas for graphical display
#
# Arguments:
#     width     Width of the canvas
#     height    Height of the canvas
#     code      Code to run (presumably using the canvas)
#
# Side effects:
#     Embeds a new canvas and stores the name in the variable CNV
#
proc ::work::canvas {width height code} {
    global cnvcount

    set ::work::CNV ${::TXT}.canvas$cnvcount
    ::canvas $::work::CNV -width $width -height $height -bg white
    $::TXT insert end "\n"
    $::TXT window create end -window $::work::CNV
    $::TXT insert end "\n"

    incr cnvcount

    namespace eval [namespace current] $code
}

# section --
#     Display a section, that is, text in a slightly larger, bold, font
#
# Arguments:
#     title     Title of the section
#
proc ::work::section {title} {
    global prepend
    namespace eval [namespace current] [list $::TXT insert end $prepend$title\n Title]
    set prepend "\n"
}

# fixed --
#     Display text in a Courier font
#
# Arguments:
#     text      Text to be displayed
#
proc ::work::fixed {text} {
    $::TXT insert end "\n"
    foreach line [split $text \n] {
        namespace eval [namespace current] [list $::TXT insert end "$line\n" Fixed]
    }
}

# handleCommand --
#     Read in the full command and run it
#
# Arguments:
#     input       Input file
#     firstLine   First line of the command
#
proc handleCommand {input firstLine} {
    set command $firstLine
    while { ! [info complete $command] } {
        if { [gets $input line] >= 0 } {
            append command "\n$line"
        } else {
            tk_messageBox -title "Problem" -icon error -type ok -message "Command not properly closed - $firstLine - $command"
            exit
        }
    }

    set command [string range $command 1 end-1]
    namespace eval ::work $command
}

# main --
#     Set up the text widget with a scrollbar
#

#
# First the text widget (including the tag properties
#
set prepend ""
set cnvcount 0
set TXT .doc
text             $TXT     -yscrollcommand ".yscroll set" \
                          -xscrollcommand ".xscroll set" \
                          -width 80 -wrap word -font "Helvetica 12"
::ttk::scrollbar .yscroll -command "$TXT yview"
::ttk::scrollbar .xscroll -command "$TXT xview" -orient horizontal

$TXT tag configure Title -font "Helvetica 16 bold"
$TXT tag configure Fixed -font "Courier 10"

grid $TXT     .yscroll -sticky news -padx 2 -pady 2
grid .xscroll -        -sticky news -padx 2 -pady 2
grid columnconfigure . 0 -weight 1
grid columnconfigure . 1 -weight 0
grid rowconfigure    . 0 -weight 1
grid rowconfigure    . 1 -weight 0

#
# Then the menubar
#
menu .menuBar -tearoff 0
.menuBar add cascade -label File -menu .menuBar.file
menu .menuBar.file -tearoff 0

.menuBar.file add command -label Exit -command exit -underline 1

. configure -menu .menuBar

wm protocol . WM_DELETE_WINDOW exit

#
# Now that that is done, we start filling the text widget
#
if { [llength $argv] == 0 } {
    tk_messageBox -title "Usage" -icon info -type ok -message "Please provide the name of a text file to display"
    exit
}

wm title . [file tail [lindex $argv 0]]

set input [open [lindex $argv 0] r]

while { [gets $input line] >= 0 } {

    if { [string length $line] == 0 } {
        $TXT insert end "\n"
        continue
    }

    set firstChar [string index $line 0]

    if { $firstChar eq "#" } {
        continue
    }
    if { $firstChar eq "\[" } {
        handleCommand $input $line
        continue
    }

    #
    # Just text? Display it
    #
    set line [namespace eval work [list subst -nocommands $line]]
    namespace eval work [list $::TXT insert end "$line "]
}
And here is an example of the sort of documents you can show:
[code {
package require Plotchart
set data {station,date,salinity,temperature
DO,2005-7-28,32.49,16.84
OS30,2005-1-1,30.08,16.71
NW2,2005-2-26,30.32,17.23
DH,2005-1-19,31.88,16.61
DO,2005-5-6,33.81,17.99
DH,2005-6-10,28.60,18.78
DH,2005-9-26,31.95,15.75
DH,2005-12-28,29.54,17.75
DH,2005-7-28,33.41,18.29
DH,2005-5-27,28.89,18.37
DH,2005-5-4,31.69,19.10
DO,2005-9-14,30.25,17.11
OS30,2005-12-28,32.48,19.77
NW1,2005-9-22,33.68,18.53
DO,2005-7-2,30.88,17.99
NW1,2005-8-15,33.32,16.52
DH,2005-8-15,29.57,15.38
NW1,2005-7-11,28.09,18.96
DH,2005-10-27,28.69,16.59
OS30,2005-1-4,29.30,15.50
NW1,2005-3-13,29.25,17.83
NW1,2005-6-12,33.86,18.46
NW1,2005-2-2,33.04,18.39
OS30,2005-9-4,33.04,19.17
DH,2005-11-15,31.99,18.65
OS30,2005-5-21,30.83,17.31
DH,2005-9-8,33.63,17.28
DO,2005-11-20,29.32,19.27
DH,2005-4-19,31.71,19.84
DO,2005-5-26,30.03,19.65
OS30,2005-6-5,30.27,15.88
NW2,2005-8-18,30.81,16.58
NW2,2005-3-12,33.88,17.72
NW1,2005-10-24,32.25,17.64
DH,2005-11-27,28.69,19.33
DH,2005-3-5,28.13,15.95
NW2,2005-10-17,32.96,16.43
NW1,2005-4-8,31.27,17.77
NW1,2005-2-3,31.69,17.03
DO,2005-12-5,33.62,15.68
NW2,2005-4-21,32.38,16.89
DO,2005-12-9,31.48,16.17
DO,2005-4-24,31.23,18.11
OS30,2005-4-7,31.91,18.04
NW2,2005-11-18,29.55,16.79
OS30,2005-2-28,30.30,18.60
NW2,2005-11-16,33.76,19.65
DH,2005-4-5,33.06,18.09
DH,2005-3-23,30.35,15.55
DH,2005-1-20,31.15,18.76
DH,2005-11-24,33.74,16.11
OS30,2005-12-24,29.05,18.55
NW2,2005-1-26,32.13,18.78
DO,2005-1-14,28.36,15.86
DH,2005-4-21,32.51,16.98
NW1,2005-1-22,32.08,16.56
OS30,2005-7-13,31.53,16.49
NW2,2005-1-28,32.37,18.79
NW2,2005-3-8,31.71,19.69
DO,2005-3-27,33.09,18.50
OS30,2005-6-7,33.39,15.73
OS30,2005-6-9,30.89,18.45
DO,2005-5-9,31.46,18.63
NW1,2005-5-5,31.21,18.62
NW2,2005-3-28,33.96,15.41
NW2,2005-3-6,33.10,15.22
DO,2005-1-12,28.82,15.60
NW2,2005-8-19,33.38,18.77
DH,2005-3-14,31.69,19.94
OS30,2005-5-10,32.47,17.85
OS30,2005-8-20,29.02,16.37
OS30,2005-6-12,32.13,16.49
NW2,2005-3-12,32.14,15.70
NW1,2005-8-17,32.65,18.88
DH,2005-11-3,30.01,18.23
NW1,2005-10-16,29.59,17.29
OS30,2005-7-27,31.30,15.95
NW2,2005-3-28,32.66,16.36
OS30,2005-5-18,28.51,18.69
DO,2005-5-20,31.85,15.43
DH,2005-8-7,28.45,16.62
DO,2005-3-13,32.36,15.14
OS30,2005-10-26,33.67,16.45
OS30,2005-3-9,28.85,16.71
NW1,2005-11-28,30.65,18.87
OS30,2005-11-21,31.82,18.62
DH,2005-1-9,29.18,19.74
OS30,2005-1-13,33.78,19.93
NW2,2005-12-10,32.23,18.95
DH,2005-9-13,30.29,19.61
DH,2005-6-7,32.38,18.98
OS30,2005-11-11,29.44,16.58
OS30,2005-1-12,32.42,19.36
NW2,2005-11-23,30.44,19.32
DO,2005-7-22,30.96,16.02
OS30,2005-6-2,32.20,19.60
NW2,2005-3-11,33.99,18.31
NW1,2005-11-7,28.70,19.09
OS30,2005-12-12,32.85,16.20
DO,2005-5-18,28.82,18.84}
set abstractedData {station,date,salinity,temperature
DO,2005-7-28,32.49,16.84
OS30,2005-1-1,30.08,16.71
NW2,2005-2-26,30.32,17.23
DH,2005-1-19,31.88,16.61
DO,2005-5-6,33.81,17.99
DH,2005-6-10,28.60,18.78
...
NW2,2005-3-11,33.99,18.31
NW1,2005-11-7,28.70,19.09
OS30,2005-12-12,32.85,16.20
DO,2005-5-18,28.82,18.84}
}]
[section Introduction]
This is a simple example of integrating data into a document explaining
them. It is no more than an illustration and the data themselves were
fabricated to provide something to work with in a different project.
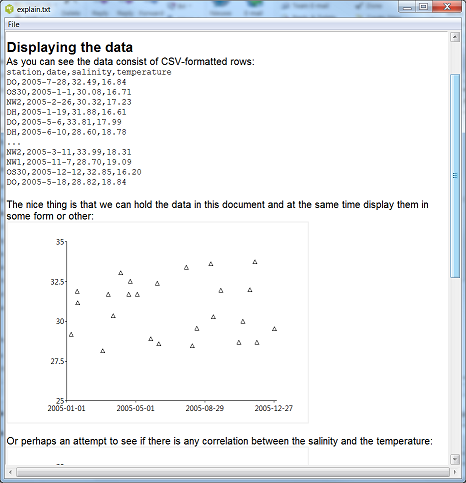
[section "Displaying the data"]
As you can see the data consist of CSV-formatted rows:
[fixed $abstractedData]
The nice thing is that we can hold the data in this document and
at the same time display them in some form or other:
[canvas 800 600 {
set p [::Plotchart::createTXPlot $CNV {2005-1-1 2006-1-1 120} {25 35 2.5}]
$p dataconfig DH -type symbol -symbol up
foreach line [lrange [split $data \n] 1 end] {
lassign [split $line ,] station date salinity temperature
if { $station eq "DH" } {
$p plot DH $date $salinity
}
}
}]
Or perhaps an attempt to see if there is any correlation between the
salinity and the temperature:
[canvas 800 600 {
set p [::Plotchart::createXYPlot $CNV {25 35 2.5} {15 20 1}]
$p dataconfig DH -type symbol -symbol up -colour cyan
$p dataconfig NW1 -type symbol -symbol down -colour green
$p dataconfig NW2 -type symbol -symbol circle -colour magenta
$p dataconfig DO -type symbol -symbol plus -colour red
$p dataconfig OS30 -type symbol -symbol cross -colour lime
foreach line [lrange [split $data \n] 1 end] {
lassign [split $line ,] station date salinity temperature
$p plot $station $salinity $temperature
}
}]
[section Conclusion]
This application defines merely a few simple commands to interact with
the text widget:
[fixed {
code - run some code
section - a simple header
fixed - to display preformatted text
canvas - to set up an embedded canvas (called $CNV) and allow a
graphical display
}]
But it is easy enough to extend this.
Languages like "R" have packages that can do much than this. But I wrote
the code in one evening, so what can you expect, feature-wise?
Seriously, though: the background idea is that scientific publishing is
more and more about being transparent wrt the data you collected and how
you treated them. With documentation facilities like this one, you can
be as open as possible, as well as allow the user to experiment with
your data.