Detecting anomalies in a time series
Arjen Markus, 14 july 2019. Recently I was confronted with a fairly large series of sensor data, high-frequency measurements of such quantities as sewater salinity, temperature and oxygen concentration. The series each contained some 25 thousand data points and there were about 50 of them. At the time I could not really think of a convenient way to detect anomalies in these series. Only by careful inspection could I determine spikes, jumps, gaps and many other oddities. But that is a rather tedious job.
Normally, to detect such anomalies you determine the statistical properties under the assumption that the series is stationary, one of those wonderful statistical concepts that make sense but are very hard to prove. So with mean and standard deviation in hand you can determine if a data point is within the expected range.
Such a method is not useable, however, if the data exhibit a trend over time or a periodical component. You would need to filter out the trend or the component first to apply the above method. And that still leaves things like sudden jumps within a plausible range ...
Last week I had an idea: why not use local estimates of the mean and standard deviation to see if the next data point is plausible? So that is what I did. The program below first constructs a time series with some noise and two visually obvious anomalies - a spike and a plateau. Then it applies the simple method indicated above:
- Take the previous 10 samples (10 being a completely arbitrary number, simply because it is nice and round and "feels" good)
- Determine mean and standard deviation from them
- Check if the new data point falls within the interval mean - 3*stdev to mean + 3*stdev (the typical Gaussian-style estimate). If it falls outside the interval, plot a red cross at this data point.
- The same for the interval mean - 5*stdev to mean + 5*stdev. the typical Gaussian-style estimate). An outlier is now marked with a lightblue dot.
Here are two typical results:
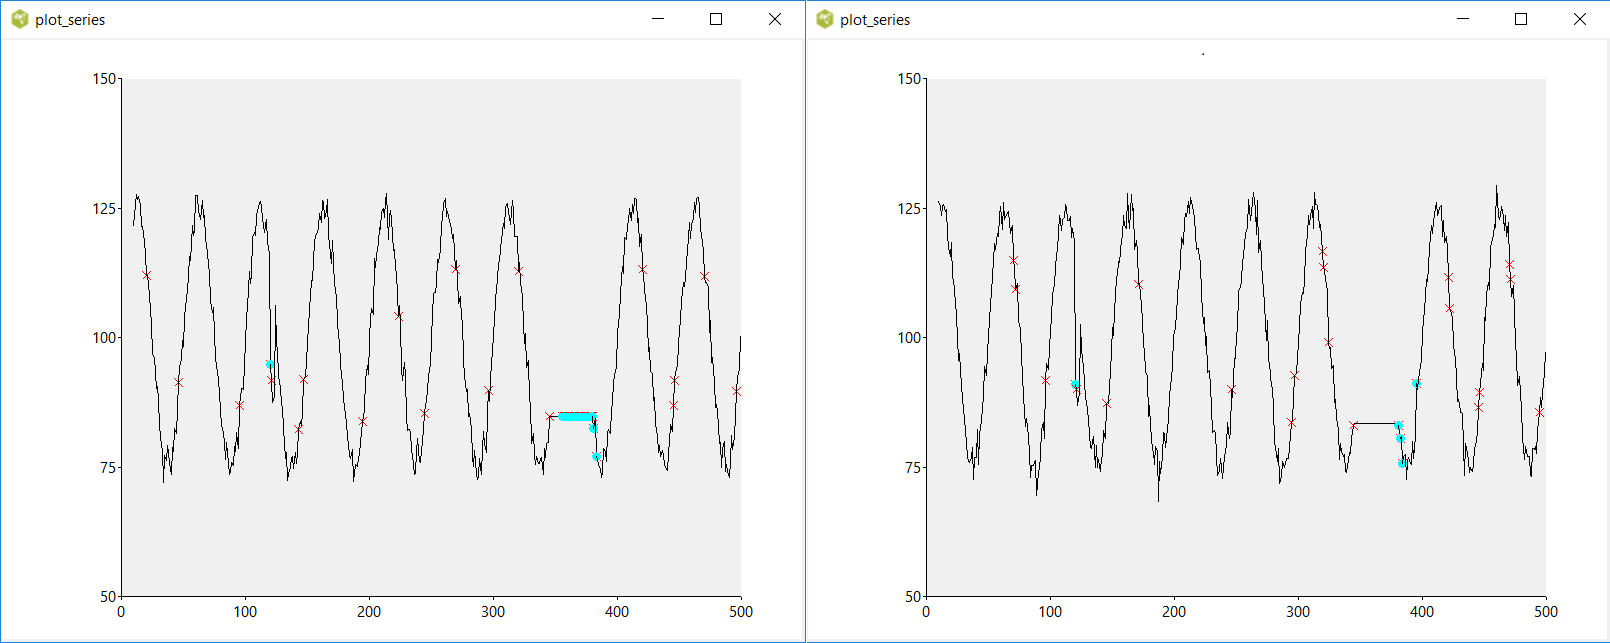
Some observations:
- There are quite a few red crosses. This criterium seems to be too strict, nothing special seems to be happening at most indicated points
- The spike is detected at the start (this is commonly the case), but the plateau is sometimes only detected at the end and sometimes throughout. The main thing is it is detected.
I have not tried other types of anomalies with a constructed time series, but it does seem to work nicely with the actual data. The "5 sigma" criterium is definitely the more useful one.
Of course, this is merely a heuristic and ad hoc algorithm without any support of a mathematical analysis. It may or may not turn out to be more generally useful ...
# plot_series.tcl --
#     Construct a time series with particular characteristics:
#     - Basically a sine signal with 50 samples per period
#     - A strange spike, but within the limits of the data
#     - A plateau
#     The data have Gaussian noise
#     Plot the result
#
package require Plotchart
package require math::statistics

pack [canvas .c -width 800 -height 600]
set p [::Plotchart::createXYPlot .c {0.0 500.0 100.0} {50.0 150.0 25.0}]

$p dataconfig line  -colour red
$p dataconfig mark  -colour cyan -type symbol -symbol dot
$p dataconfig cross -colour red -type symbol -symbol cross

#
# Construct the time series
#
set randomData [::math::statistics::random-normal 0.0 2.0 500]

set twopi [expr {2.0 * acos(-1.0)}]

set data         {}
set mean      100.0
set amplitude  25.0
for {set t 0} {$t < 500} {incr t} {
    set value [expr {$mean + $amplitude * sin($twopi * $t / 50.0) + [lindex $randomData $t]}]

    # Spike
    if { $t >= 120 && $t <= 123 } {
        set value [expr {$value - 20.0}]
    }

    # Plateau
    if { $t == 345 } {
        set plateau $value
    }
    if { $t >= 345 && $t <= 380 } {
        set value $plateau
    }

    lappend data $value
}

#
# Analyse and plot the data
#

set numberData [llength $data]
set sampleSize 10

for {set i $sampleSize} {$i < $numberData} {incr i} {
    set sample [lrange $data [expr {$i - $sampleSize -1}] [expr {$i - 1}]]
    set mean  [::math::statistics::mean  $sample]
    set stdev [::math::statistics::stdev $sample]

    set value [lindex $data $i]

    $p plot data $i $value

    if { abs($mean-$value) > 3.0 * $stdev } {
        #puts $outfile "$i - $value - $mean - $stdev"
        #$p plot line $i 50.0
        #$p plot line $i 150.0
        #$p plot line {} {}
        $p plot cross $i $value
    }
    if { abs($mean-$value) > 5.0 * $stdev } {
        $p plot mark $i $value
    }
}