Plotchart gallery
Arjen Markus (30 may 2007)
For testing and exhibiting the features of Plotchart, I have a small set of programs. They are all part of the CVS repository, so for the most recent versions, I will refer you to the Tklib project.
For the moment, I have not included all the code here (just laziness and lack of time), but perhaps I will do so later.
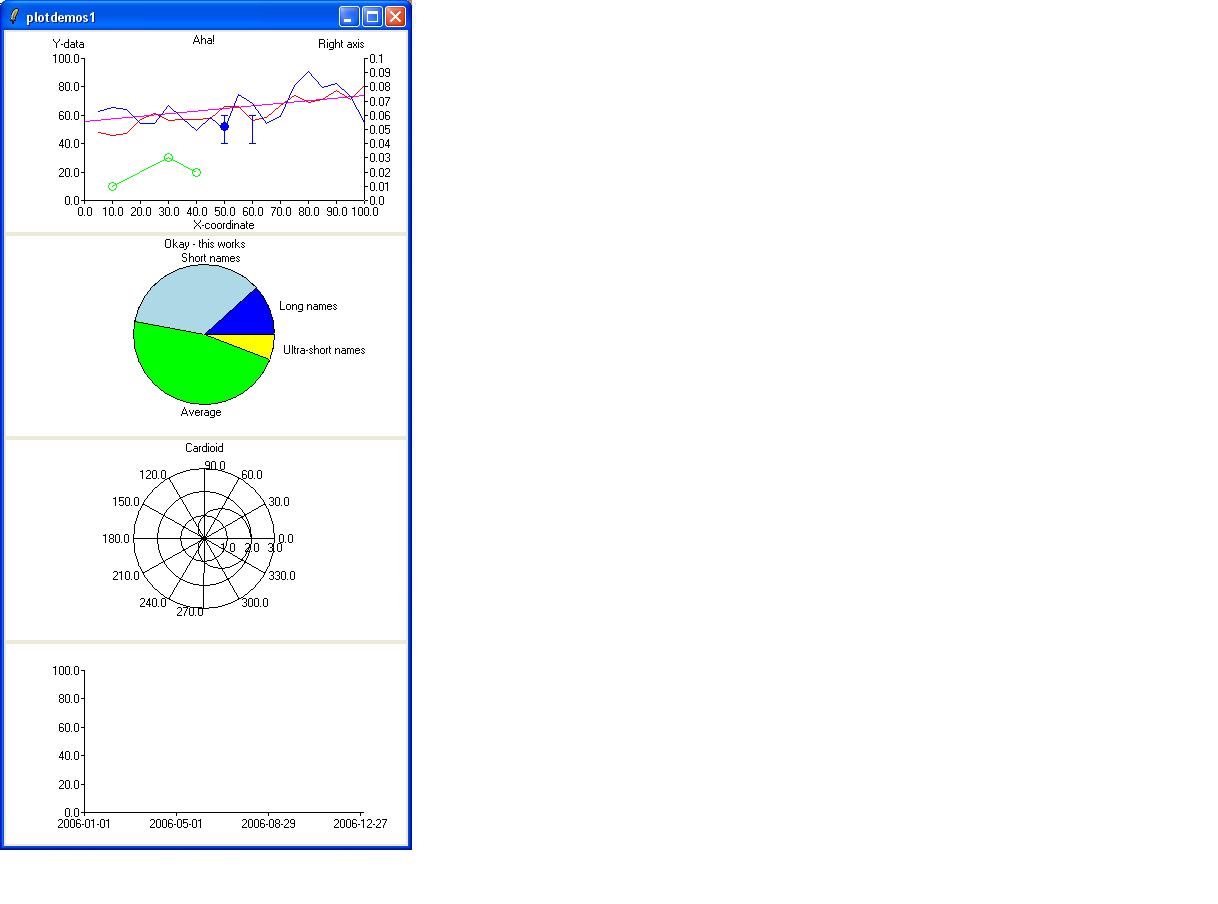
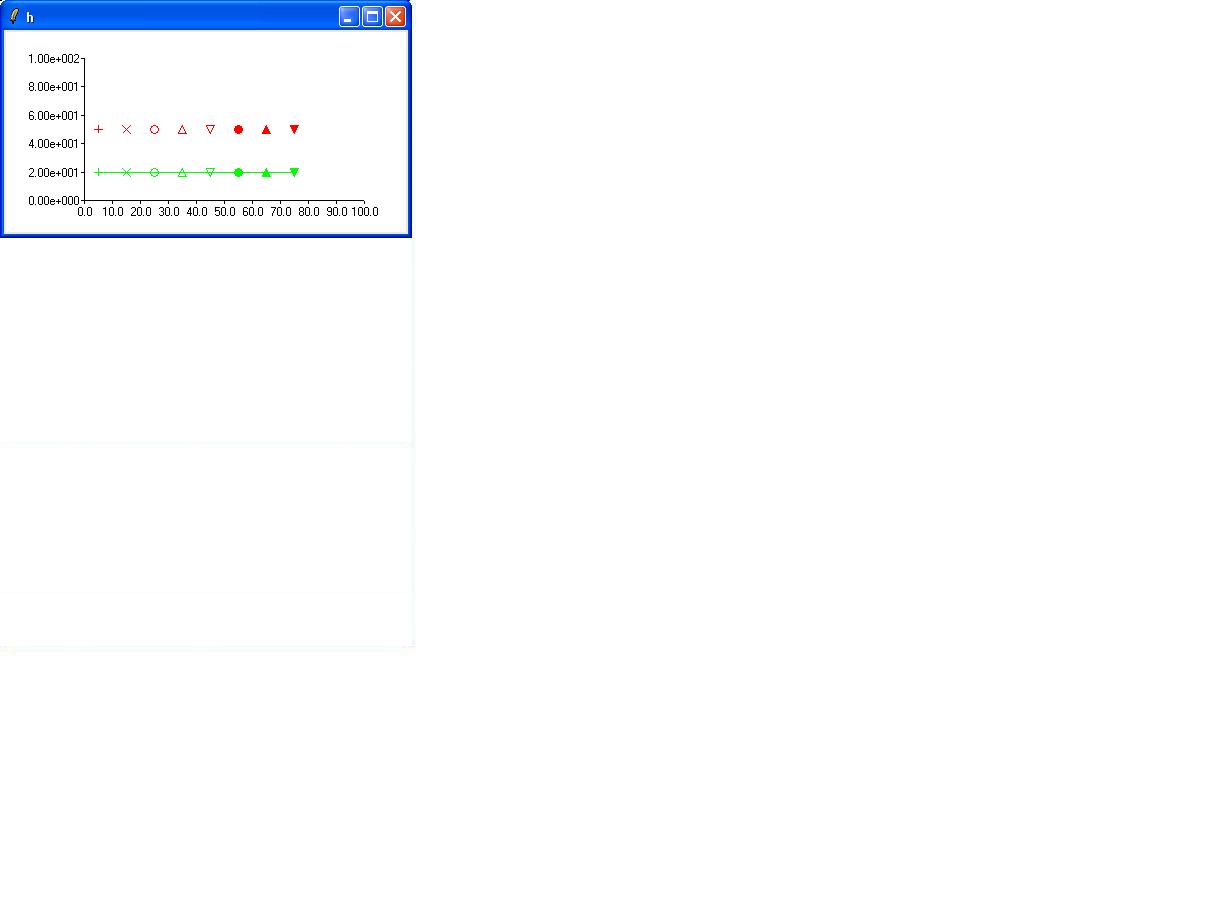
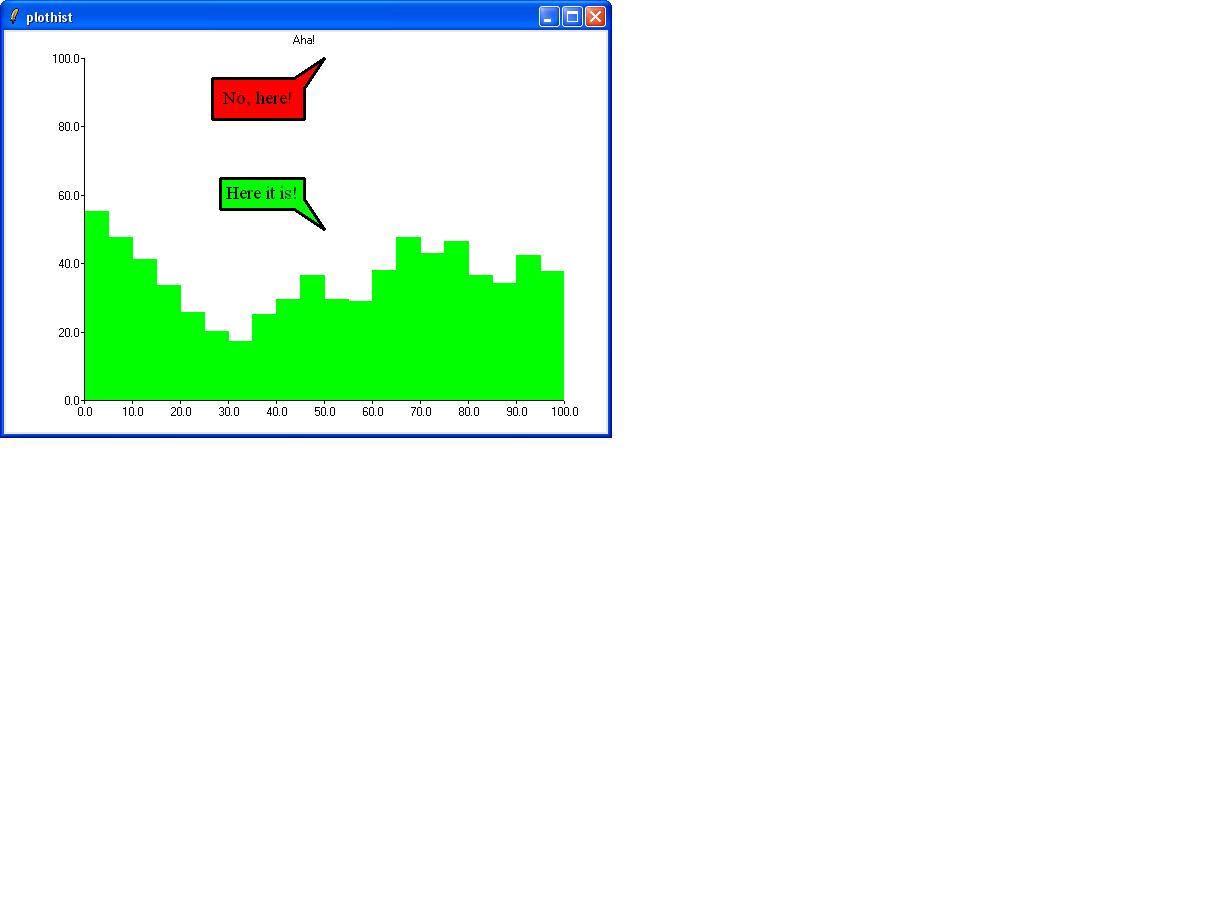
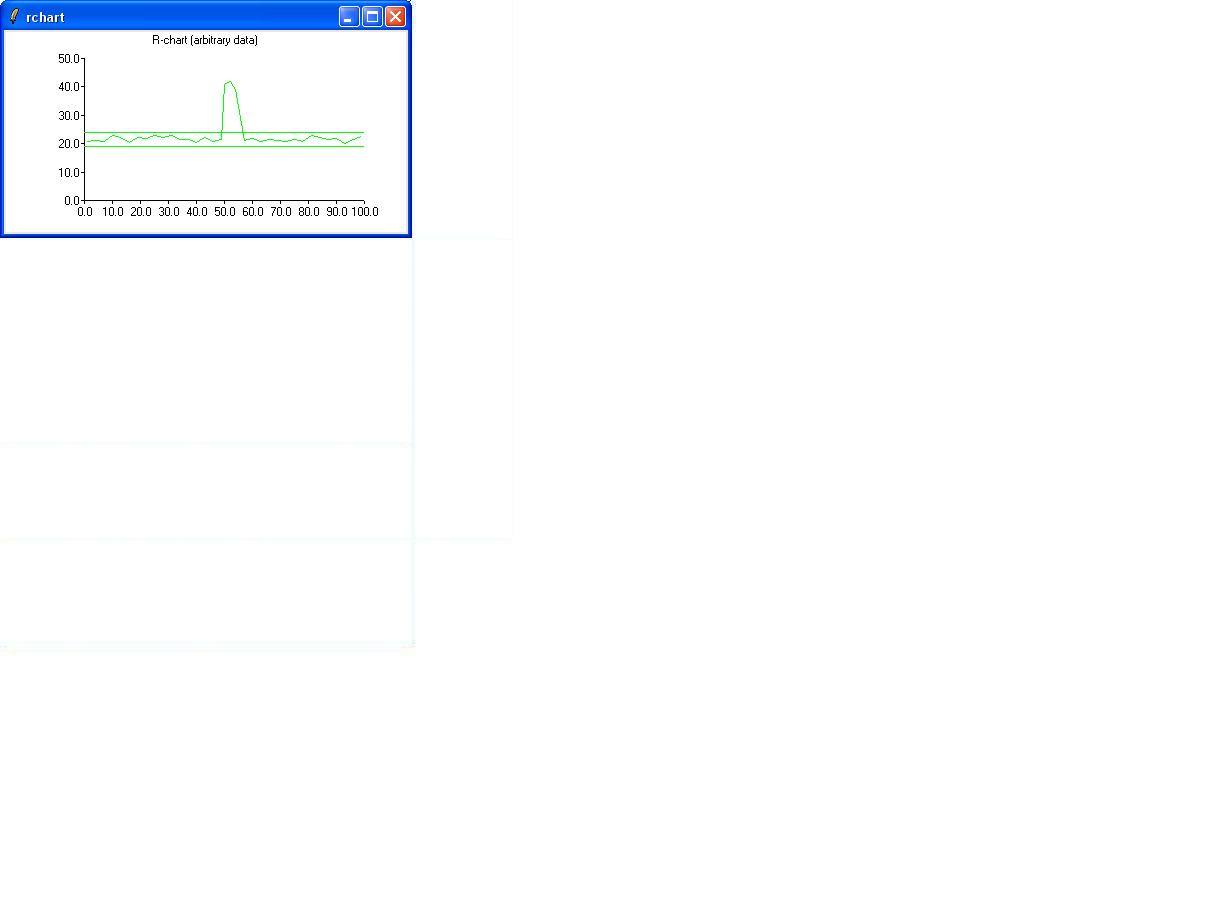
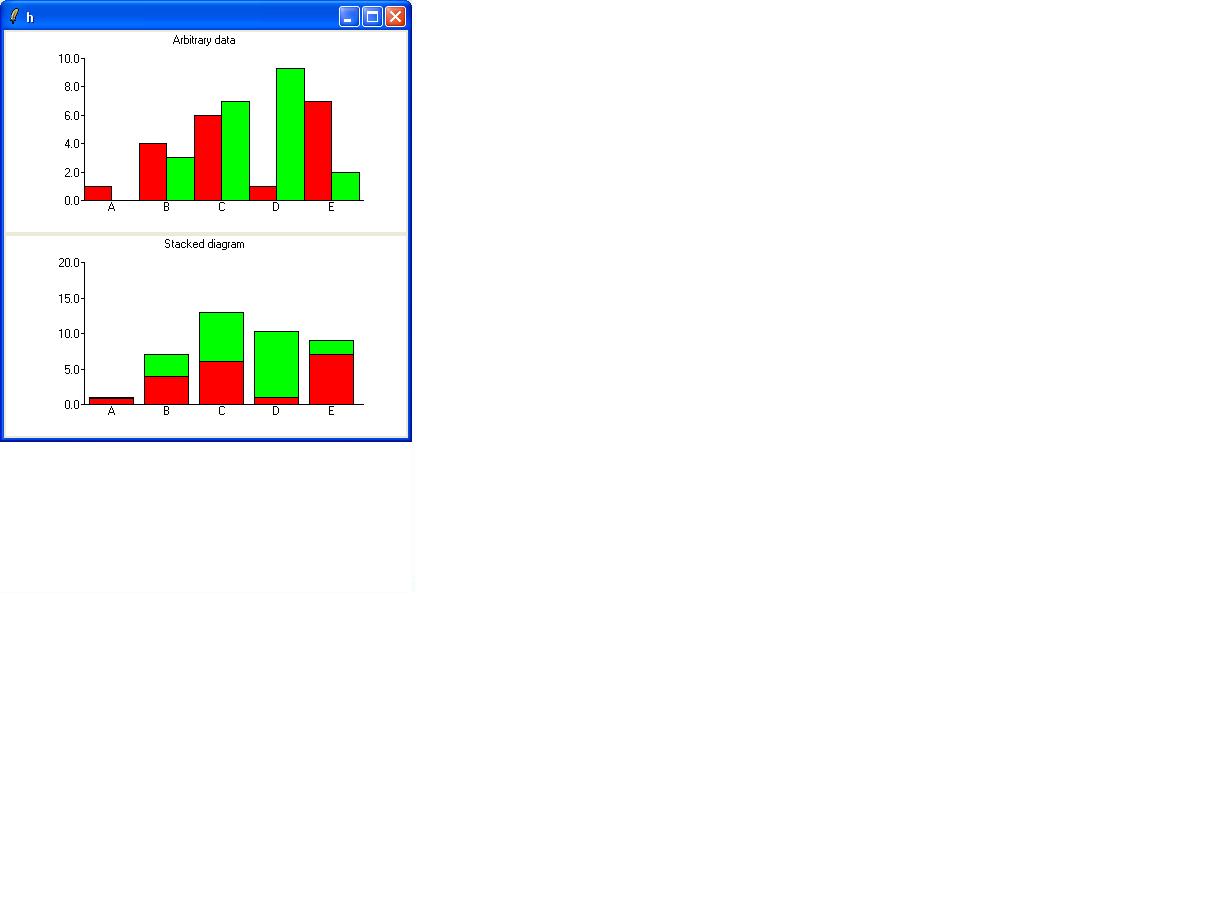
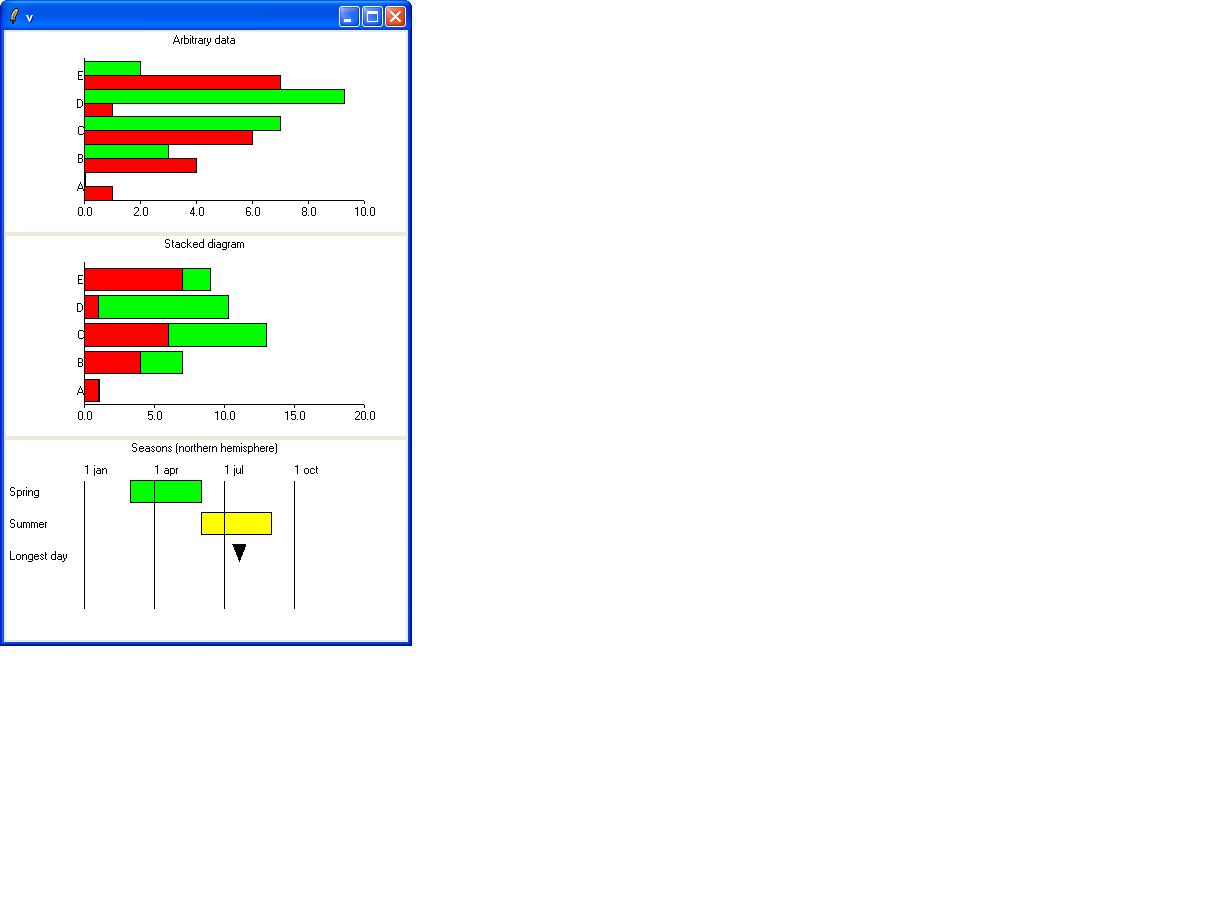
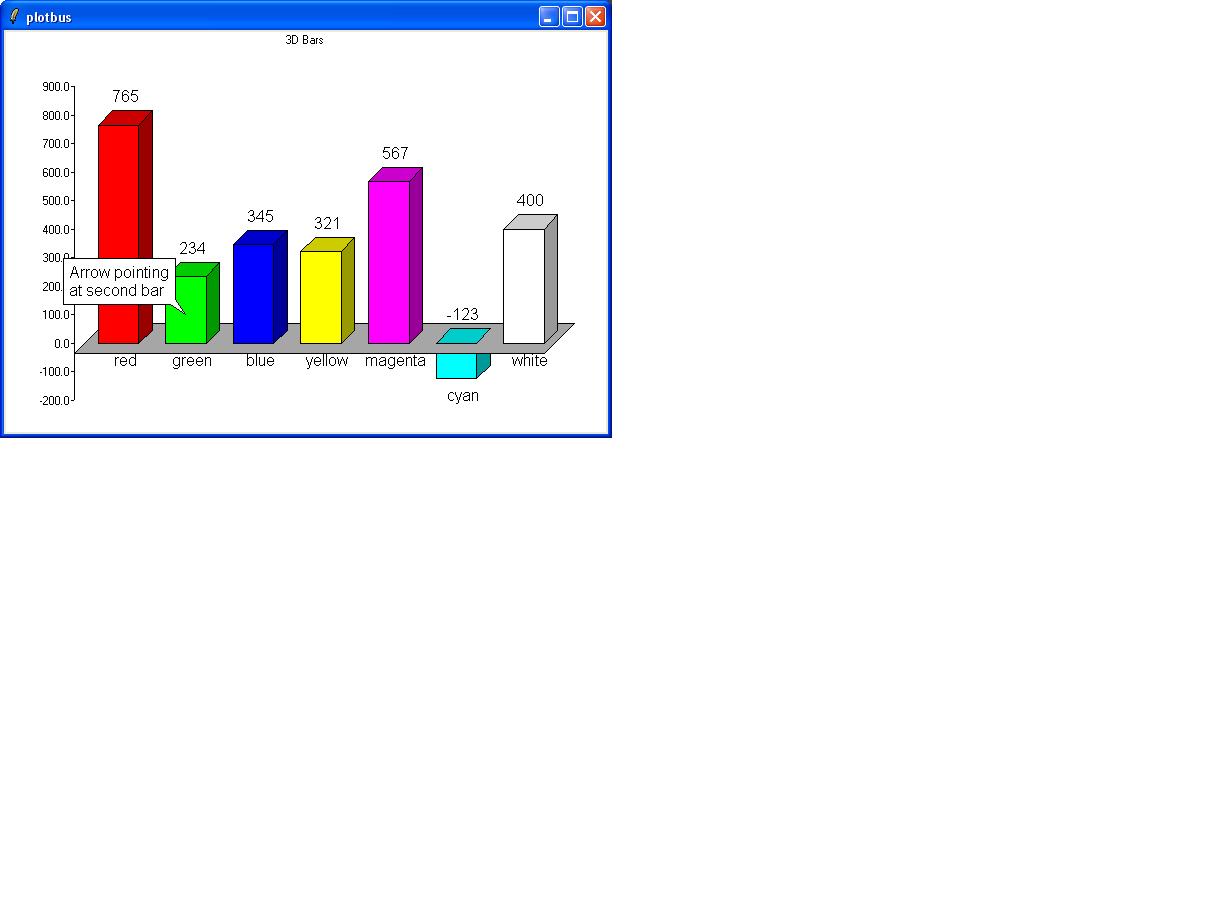
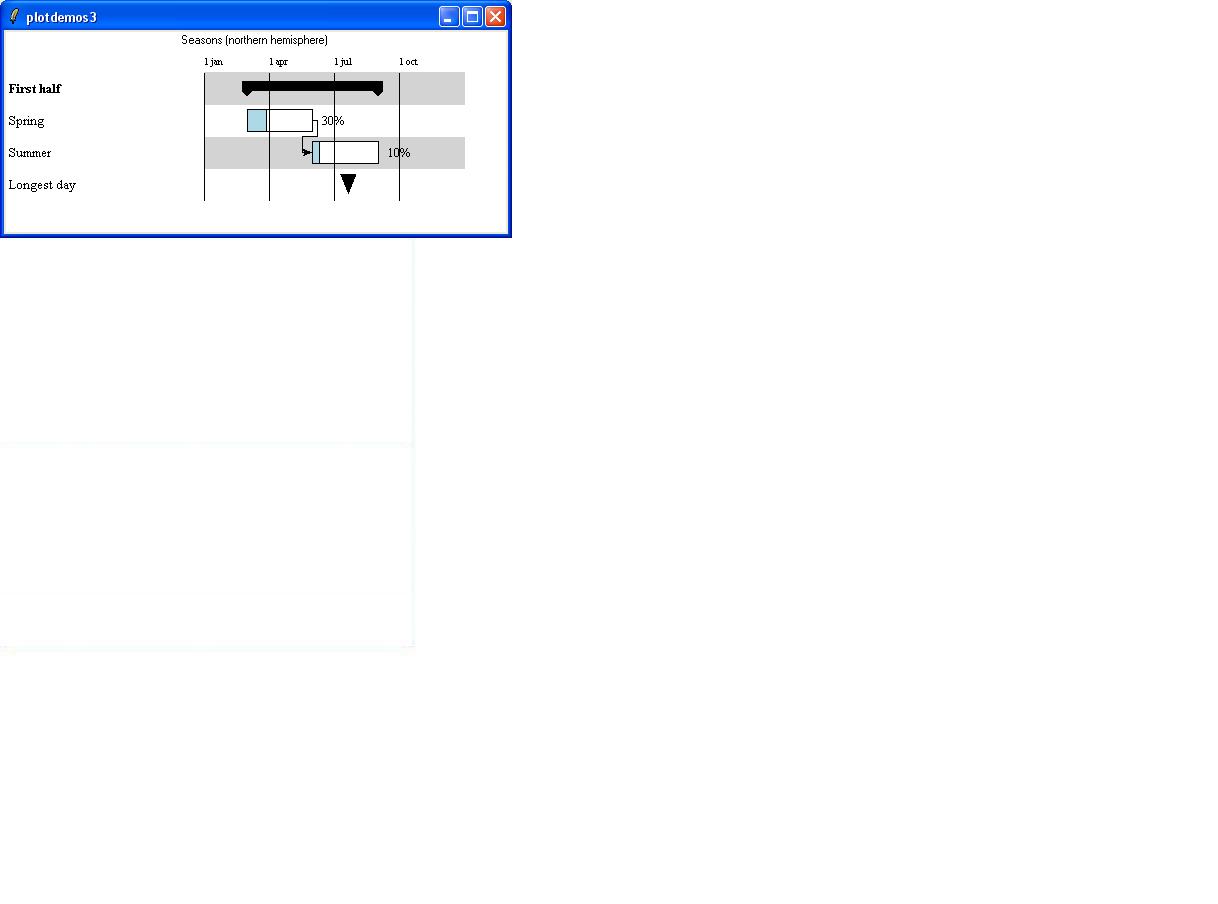
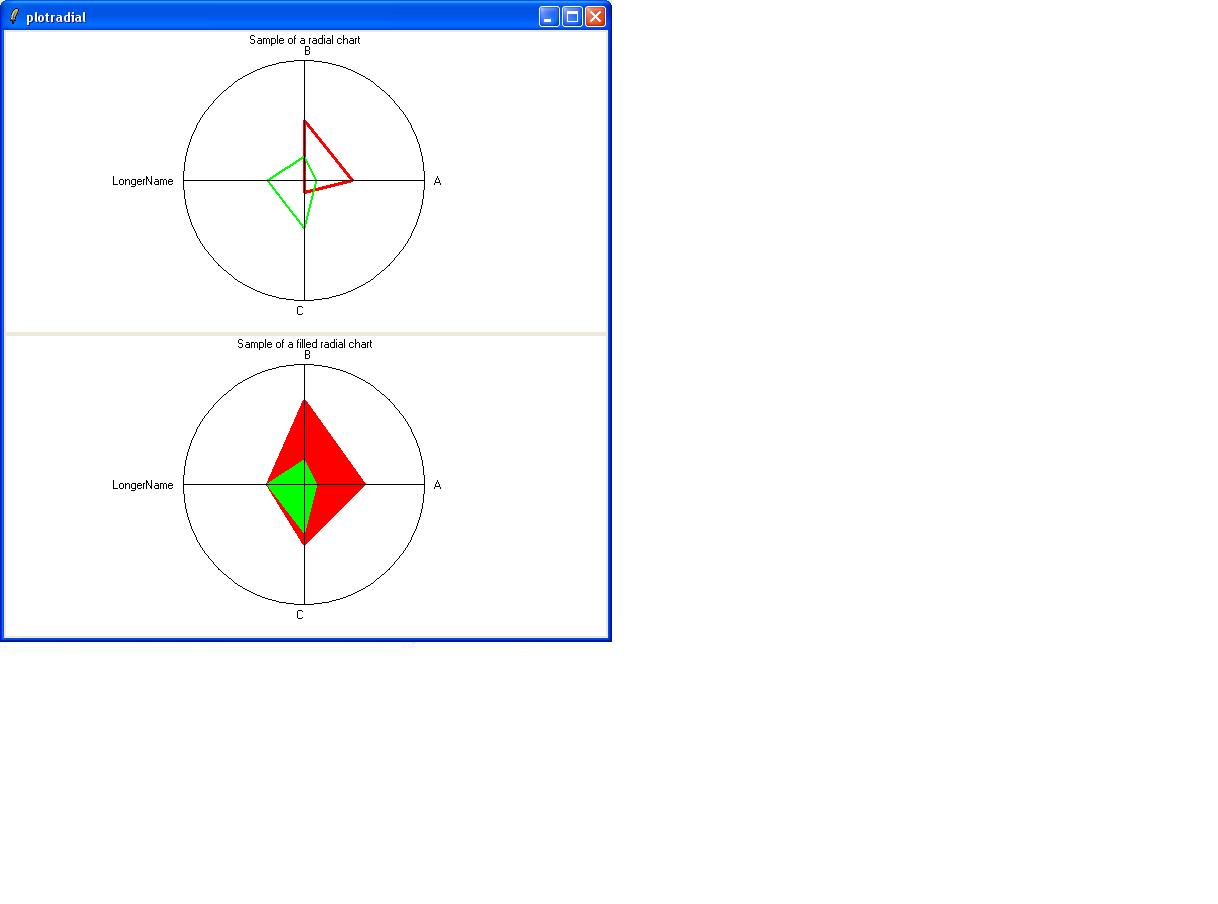
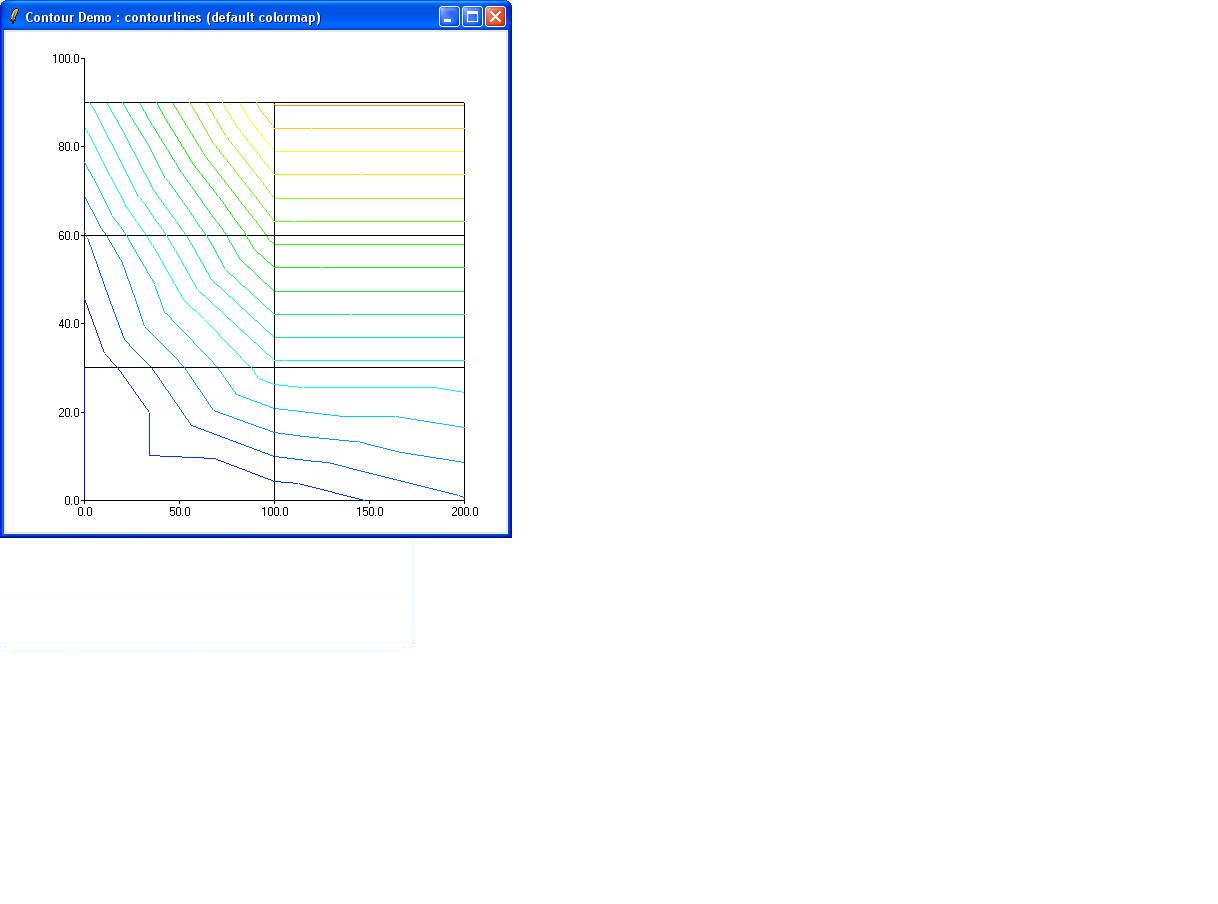
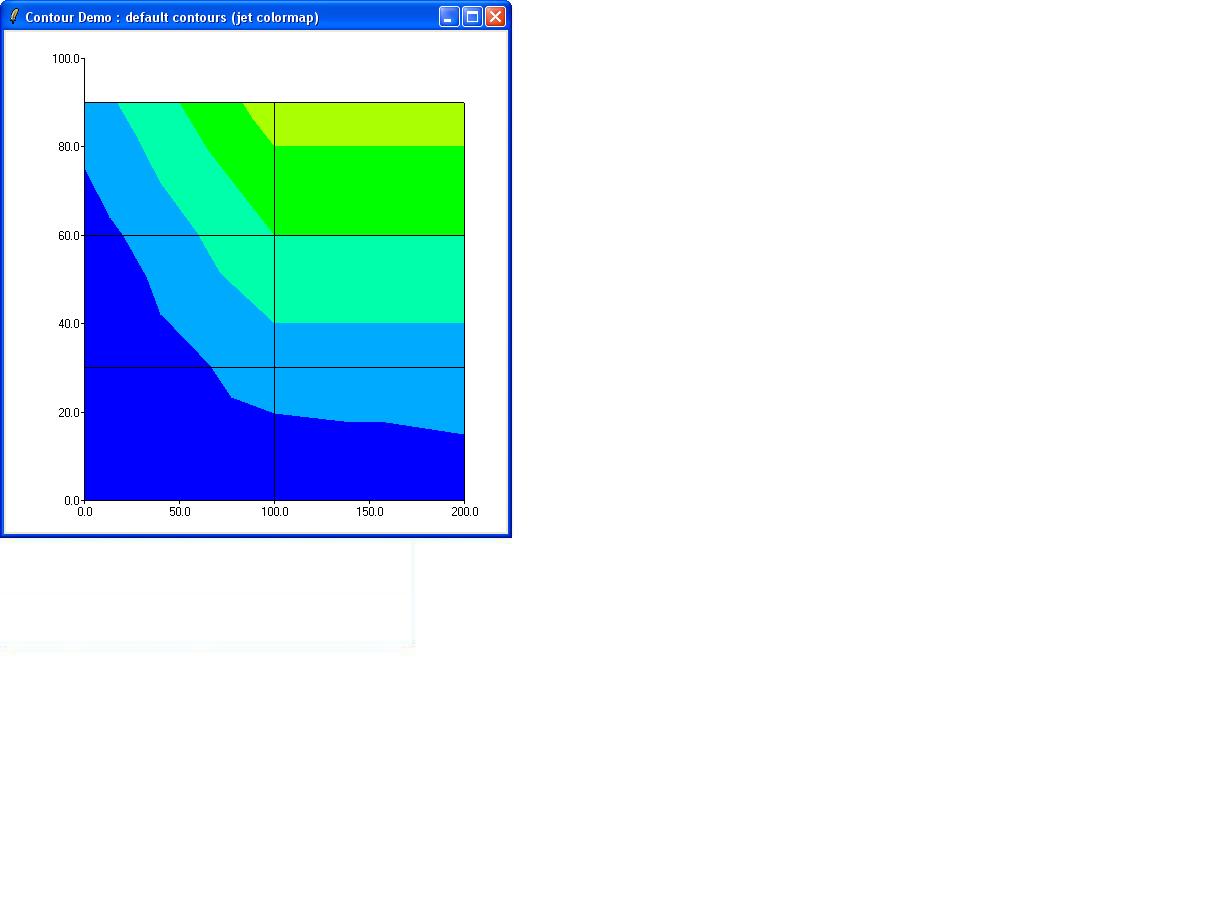
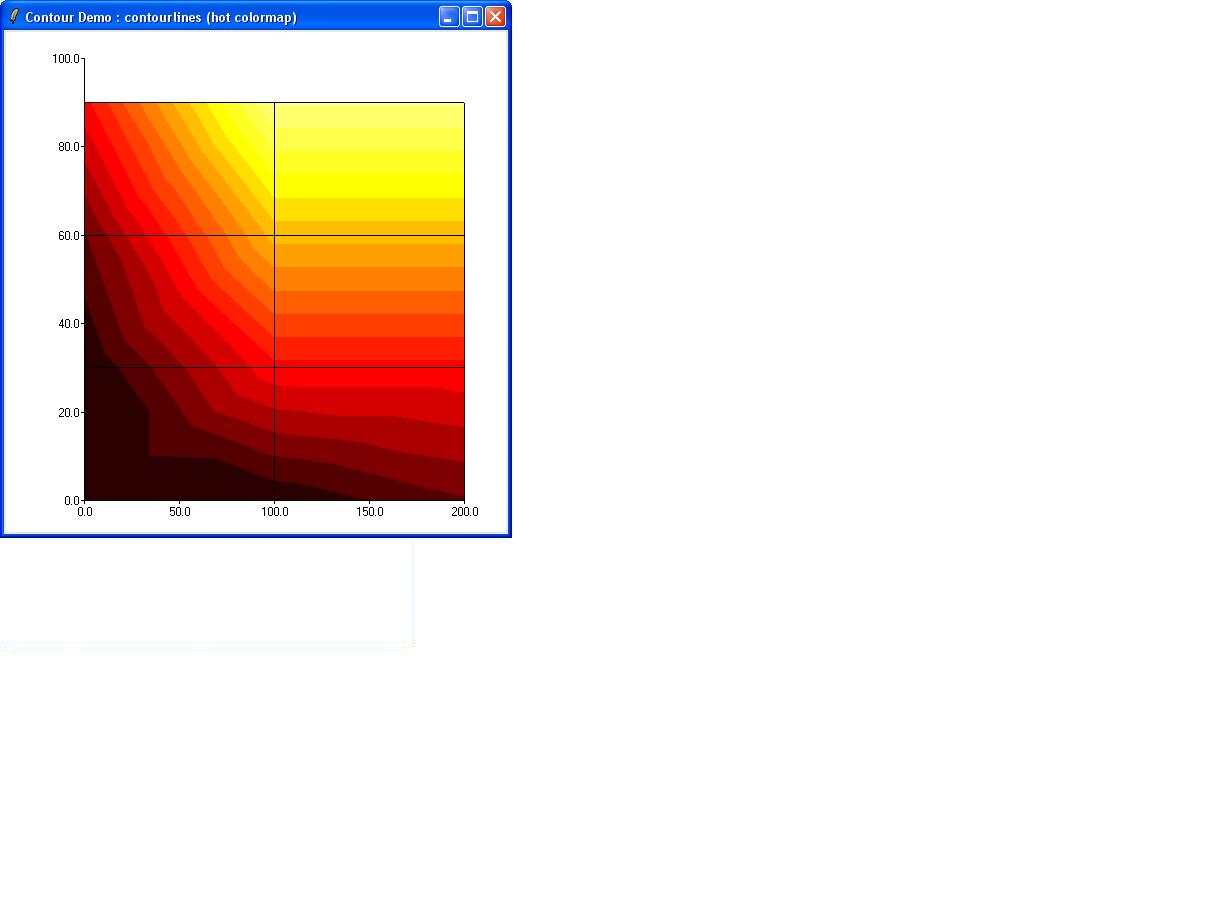
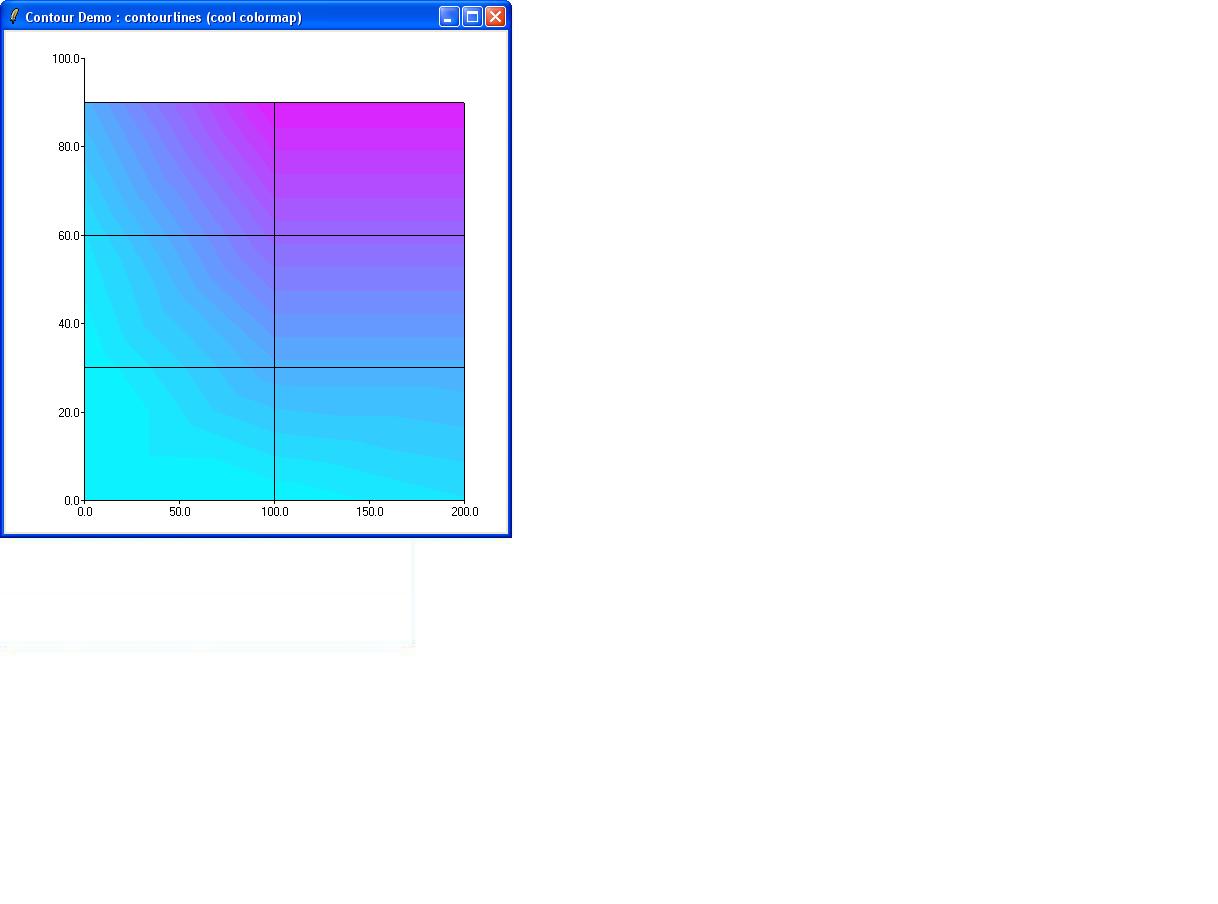
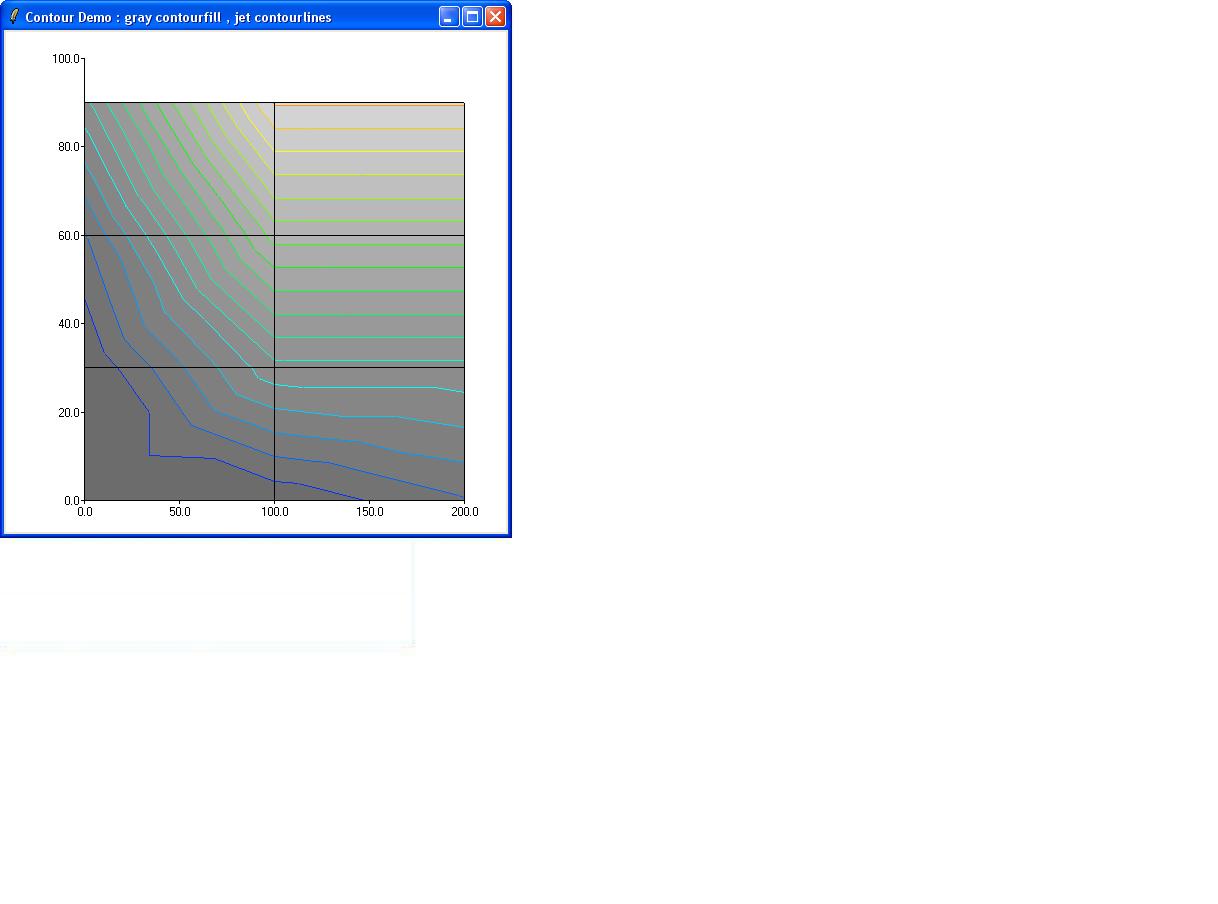
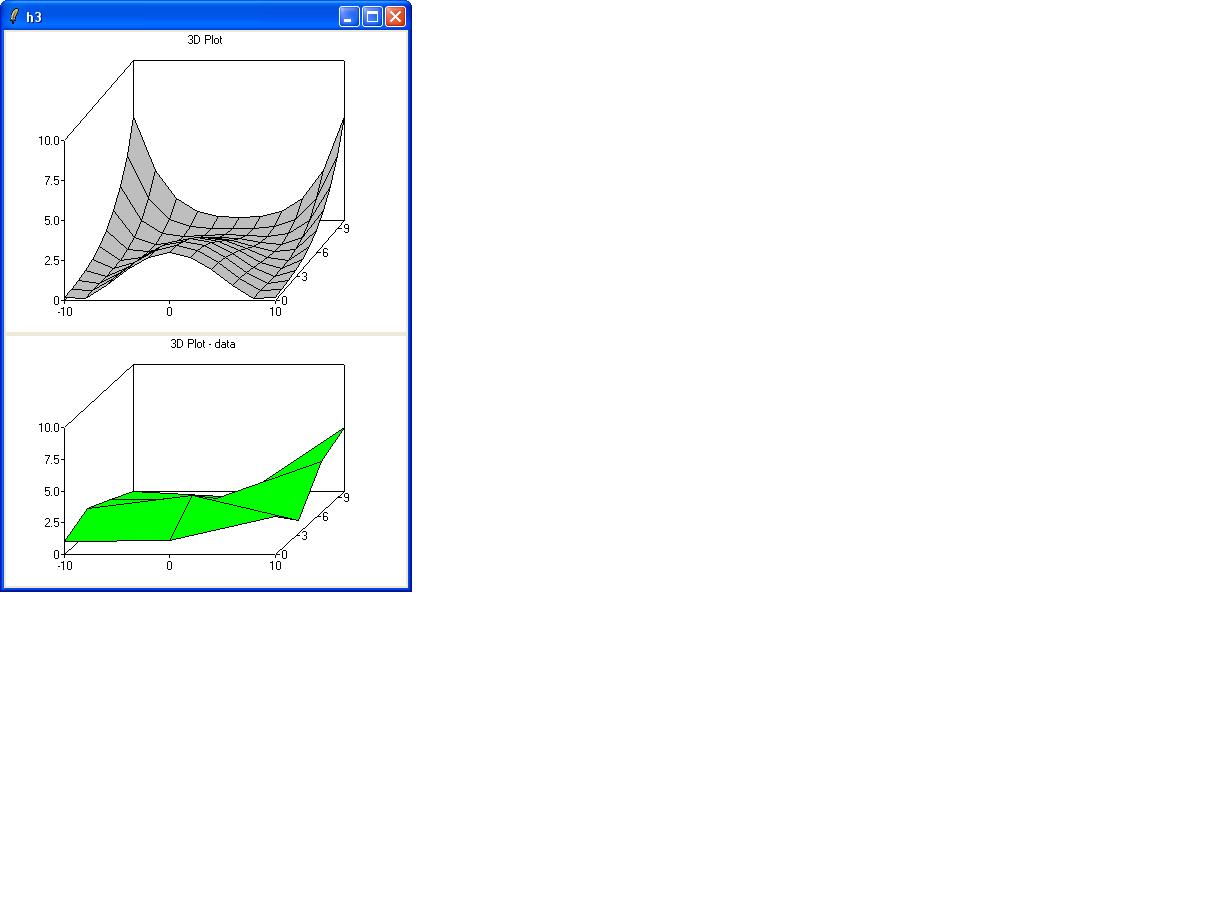
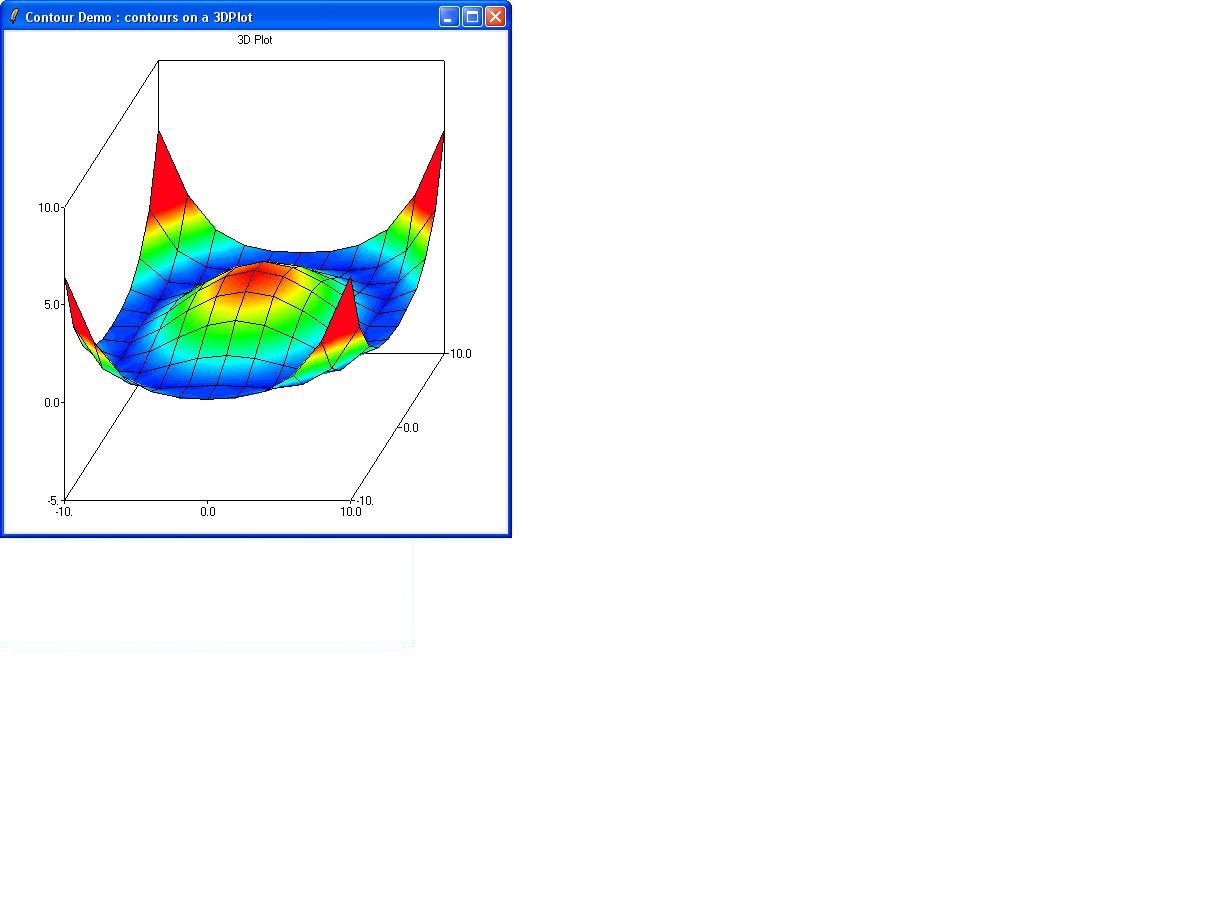
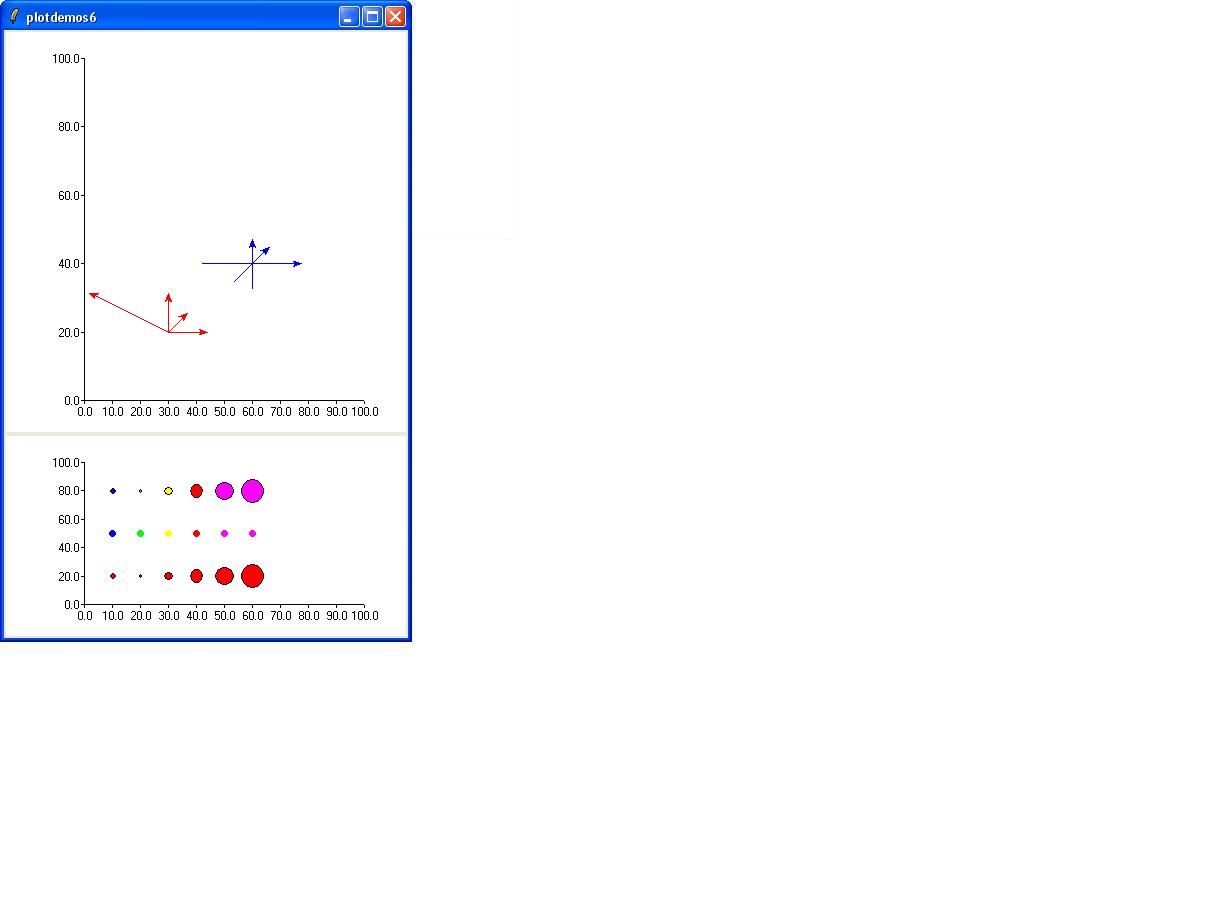
Gallery of Plotchart features
Not all features are shown yet:
- Stripcharts and isometric plots are missing
- Grid lines (ticklines)
- Legends
- Numerous options (like background colours)
Example of how to create one of the pictures:
#
# Create the canvas widget and the XY plot
# (the right axis derives certain properties from the original plot!)
#
# Important:
# Set the extremes for the axis
#

package require Plotchart

canvas .c  -background white -width 400 -height 200
pack .c -fill both

set s [::Plotchart::createXYPlot .c {0.0 100.0 10.0} {0.0 100.0 20.0}]
set r [::Plotchart::createRightAxis .c {0.0 0.1 0.01}]

#
# Add the data to the plot
#
set xd    5.0
set yd   20.0
set xold  0.0
set yold 50.0

$s dataconfig series1 -colour "red"
$s dataconfig series2 -colour "blue"
$s dataconfig series3 -colour "magenta"

for { set i 0 } { $i < 20 } { incr i } {
    set xnew [expr {$xold+$xd}]
    set ynew [expr {$yold+(rand()-0.5)*$yd}]
    set ynew2 [expr {$yold+(rand()-0.5)*2.0*$yd}]
    $s plot series1 $xnew $ynew
    $s plot series2 $xnew $ynew2
    $s trend series3 $xnew $ynew2
    set xold $xnew
    set yold $ynew
}

#
# Some "intervals" and other things to show that Plotchart can
# do that too
#
$s interval series2 50.0 40.0 60.0 52.0
$s interval series2 60.0 40.0 60.0

$s xtext "X-coordinate"
$s ytext "Y-data"
$r ytext "Right axis"
$s title "Aha!"

#
# Some data for the right axis
#
$r dataconfig right -type both -symbol circle -colour green
$r plot right 10.0 0.01
$r plot right 30.0 0.03
$r plot right 40.0 0.02

#
# Save the picture
#
tkwait visibility .c
$s saveplot "aha.ps"