Plotting a score card - an experiment
Plotting a score card
Arjen Markus (29 may 2022) I was faced with the problem of presenting the scores of an evaluation procedure. The subject: judge the suitability of datasets. The datasets are judged on a variety of criteria, but the challenge was that there were two sets of criteria and we need to combine them in such a way that the scores for each set are visible and the overall score. To keep it short:
- We have seven categories with each two scores
- The categories differ in importance for the two sets, but most categories have criteria in both sets.
One way of dealing with this problem is via a "spider diagram" or a "radial plot", as they are called in Plotchart. But then it is difficult to see the combination - the two lines representing the score for each set would cross each other most probably and what would that mean?
A chart type in use in reports on climate change gave me the inspiration to come up with a slightly different approach:
- Each category is represented by a sector in a circle.
- The relative weight for the sets of criteria determine the _maximum_ area that that particular set can fill up. The rest goes to the other set.
- The scores per set for such a criterium determine how much is actually filled in.
- What is left over - the shortcomings for that particular category - is coloured in a backgrund colour.
Here is the resulting plot, well, it is an example and to keep it general I have left out the particular texts.
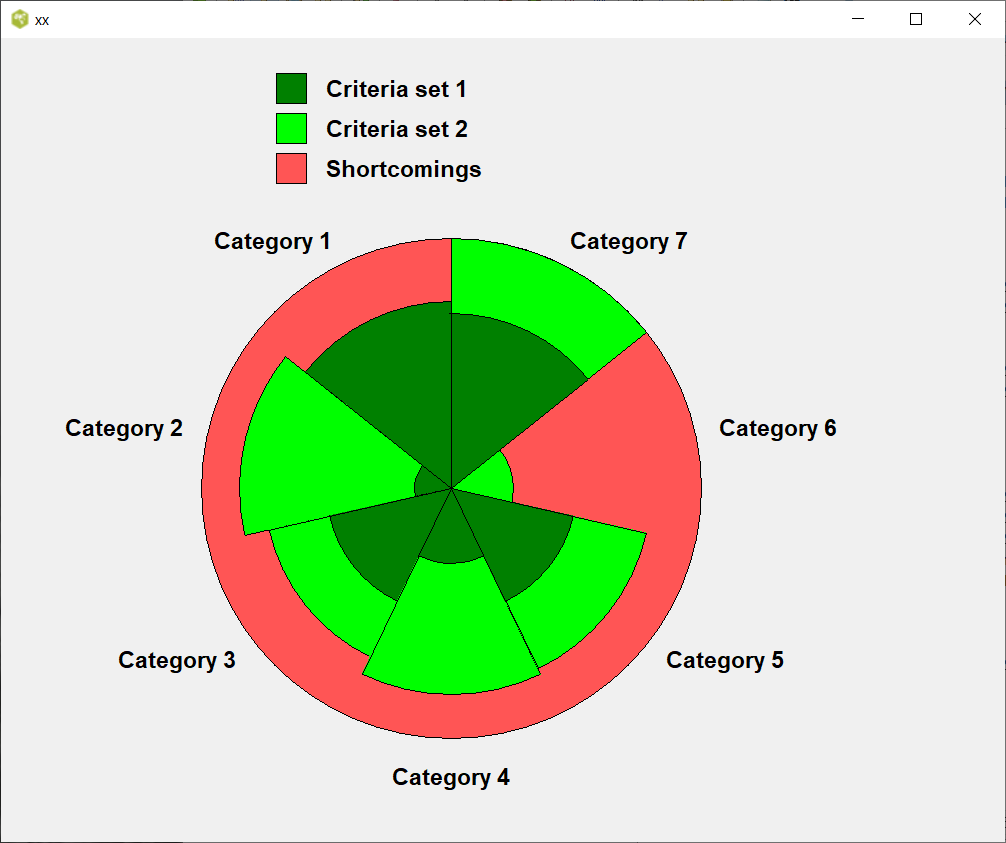
The code given below draws this plot. The input consists of:
- A file containing the names of the categories, the weight and the maximum scores.
- A file with the actual scores.
Nothing mysterious: it is an experiment. And the data are completely arbitrary.
The first file (maxscore.inp):
Category 1,  100,  4,   0
Category 2,   30,  6,   2
Category 3,   50,  2,   4
Category 4,   30,  2,   8
Category 5,   70, 14,   4
Category 6,    0,  0,   4
Category 7,   70,  6,   4
The second file (actual scores, score.inp):
Category 1,    3,   0
Category 2,    3,   2
Category 3,    2,   2
Category 4,    2,   6
Category 5,   10,   4
Category 6,    0,   1
Category 7,    6,   4
And the code, a trifle ad hoc, but it serves to illustrate the graphical representation:
# plotscore.tcl --
#     Prototype for scoring plots:
#     - The circle is filled with segments for the seven categories
#     - Each segment is divided in two parts, one for each set of criteria
#     - The maximum area assigned to the two aspects depends on the weight for the first set of criteria
#     - The actual area depends on the actual score
#

#
# Set up the canvas with the central circle
#
pack [canvas .c -width 1000 -height 800]

set xleft   200
set ytop    200
set xright  700
set ybottom 700
.c create oval $xleft $ytop $xright $ybottom -fill #ff5555

#
# Read the category information
#
set infile [open "maxscore.inp"]

set categories {}
while { [gets $infile line] >= 0 } {
    lappend categories [split $line ,]
}

close $infile

#
# Read the actual scores
#
set infile [open "score.inp"]

set scores {}
while { [gets $infile line] >= 0 } {
    lappend scores [split $line ,]
}

close $infile

#
# Draw the sectors
#
set angle 90.0
set dangle [expr {360.0 / [llength $categories]}]

set xcentre [expr {($xleft  + $xright)  / 2.0}]
set ycentre [expr {($ytop   + $ybottom) / 2.0}]
set radius  [expr {($xright - $xleft)   / 2.0}]

set torad   [expr {acos(-1.0)/180.0}]

foreach category $categories score $scores {
    set weight        [expr {[lindex $category 1] / 100.0}]
    set score1 [expr {[lindex $score 1] / double([lindex $category 2] + 0.000001)}]
    set score2 [expr {[lindex $score 2] / double([lindex $category 3] + 0.000001)}]

    set radius1       [expr {$radius * $weight * $score1}]
    set radius2       [expr {$radius1 + $radius * (1.0 - $weight) * $score2}]

    set xscoreL       [expr {$xcentre - $radius2}]
    set xscoreR       [expr {$xcentre + $radius2}]
    set yscoreT       [expr {$ycentre - $radius2}]
    set yscoreB       [expr {$ycentre + $radius2}]

    .c create arc $xscoreL $yscoreT $xscoreR $yscoreB -fill lime -start $angle -extent $dangle

    set xscoreL       [expr {$xcentre - $radius1}]
    set xscoreR       [expr {$xcentre + $radius1}]
    set yscoreT       [expr {$ycentre - $radius1}]
    set yscoreB       [expr {$ycentre + $radius1}]

    .c create arc $xscoreL $yscoreT $xscoreR $yscoreB -fill green -start $angle -extent $dangle

    set at [expr {$angle + $dangle/2.0}]
    set xt [expr {$xcentre + 1.1 * $radius * cos($at*$torad)}]
    set yt [expr {$ycentre - 1.1 * $radius * sin($at*$torad)}]

    if { $at > 90.0 && $at < 260.0} {
        set anchor e
    } elseif { $at > 260.0 && $at < 280.0 } {
        set anchor n
    } else {
        set anchor w
    }

    .c create text $xt $yt -text [lindex $category 0] -font "Helvetica 14 bold" -anchor $anchor

    set angle [expr {$angle + $dangle}]
}

#
# Circles for reference: 50% and 70% of the area (!)
# Skipped
#
if {0} {

foreach percentage {50 70} {
    set radiusP [expr {$radius * sqrt($percentage / 100.0)}]

    set xscoreL [expr {$xcentre - $radiusP}]
    set xscoreR [expr {$xcentre + $radiusP}]
    set yscoreT [expr {$ycentre - $radiusP}]
    set yscoreB [expr {$ycentre + $radiusP}]

    .c create oval $xscoreL $yscoreT $xscoreR $yscoreB -width 2
}
}

#
# The legend
#
.c create rectangle [expr {$xcentre - 0.7*$radius}]  35 [expr {$xcentre - 0.7*$radius + 30}]  65 -fill green
.c create rectangle [expr {$xcentre - 0.7*$radius}]  75 [expr {$xcentre - 0.7*$radius + 30}] 105 -fill lime
.c create rectangle [expr {$xcentre - 0.7*$radius}] 115 [expr {$xcentre - 0.7*$radius + 30}] 145 -fill #ff5555

.c create text [expr {$xcentre - 0.7*$radius + 50}]  50 -text "Criteria set 1" -font "Helvetica 14 bold" -anchor w
.c create text [expr {$xcentre - 0.7*$radius + 50}]  90 -text "Criteria set 2" -font "Helvetica 14 bold" -anchor w
.c create text [expr {$xcentre - 0.7*$radius + 50}] 130 -text "Shortcomings"   -font "Helvetica 14 bold" -anchor w