Plotting the contents of a table
Arjen Markus (19 july 2023) I often want to visualise the contents of a file containing some table. Of course, I can load it into a spreadsheet program, make sure it understands that the data are numerical and have to put into separate columns, select the columns I want to plot against each other, add the plot with the right type and done. But that is a lot of steps, where quite often I merelywant to inspect the data and draw some conclusion from them.
So, last week I had time to procrastinate a bit and the result, after some embellishments, is the script below. Nothing brilliant and the graphs it produces are rather frugal, but it gets the job done.
# plottable.tcl --
#     A very simple program to plot graphs based on a table
#
package require Plotchart

if { [llength $argv] == 0 } {
    tk_messageBox -type ok -message "Usage: plottable name-of-file" -title "Usage"
    exit
}

set infile [open [lindex $argv 0]]

#
# Read the first line to determine whether there is a header or not
#
set line [gets $infile]

if { [regexp {[a-zA-Z]} $line] > 0 } {
    set skip    1
    set columns $line
    set line [gets $infile]
} else {
    set skip    0
    set columns {}
    set i       1
    foreach value $line {
        lappend columns "Column $i"
        incr i
    }

    seek $infile 0
}

#
# Determine the extreme values
#
foreach value $line {
    lappend value_min $value
    lappend value_max $value
}
while { [gets $infile line] >= 0 } {
    set i 0
    foreach value $line vmin $value_min vmax $value_max {
        if { $value < $vmin } {
            lset value_min $i $value
        }
        if { $value > $vmax } {
            lset value_max $i $value
        }
        incr i
    }
}

#
# Set up the GUI
#
. configure -bg white
wm title . "Viewing [lindex $argv 0]"

set styles {Line Symbol "Line and symbol"}

grid [::ttk::label .lx -text "X-axis:" -width 10]    [::ttk::combobox .cx     -values $columns -state readonly -width 20] [::ttk::label .space  -text " "] \
     [::ttk::label .ly -text "Y-axis:" -width 10]    [::ttk::combobox .cy     -values $columns -state readonly -width 20] [::ttk::label .space2 -text " "] \
     [::ttk::label .lstyle -text "Style:" -width 10] [::ttk::combobox .cstyle -values $styles  -state readonly -width 20] \
     [::ttk::button .plot -text "Plot" -width 5 -command Drawgraph] -padx 2
grid [canvas .c -width 800 -height 500] - - - - - - - -

.cx     current 0
.cy     current 1
.cstyle current 0


proc Drawgraph {} {
    global value_min
    global value_max
    global infile
    global skip

    set xcol [.cx current]
    set ycol [.cy current]
    set style [lindex {line symbol both} [.cstyle current]]

    .c delete all

    #
    # Read the file again and make a plot
    #
    set xscale [::Plotchart::determineScale [lindex $value_min 0] [lindex $value_max $xcol]]
    set yscale [::Plotchart::determineScale [lindex $value_min 1] [lindex $value_max $ycol]]

    set p [::Plotchart::createXYPlot .c $xscale $yscale]

    $p dataconfig data -type $style

    seek $infile 0
    for {set i 0} {$i < $skip} {incr i} {
        gets $infile line
    }

    while { [gets $infile line] >= 0 } {
        $p plot data [lindex $line $xcol] [lindex $line $ycol]
    }
}

# Draw the default graph

Drawgraph
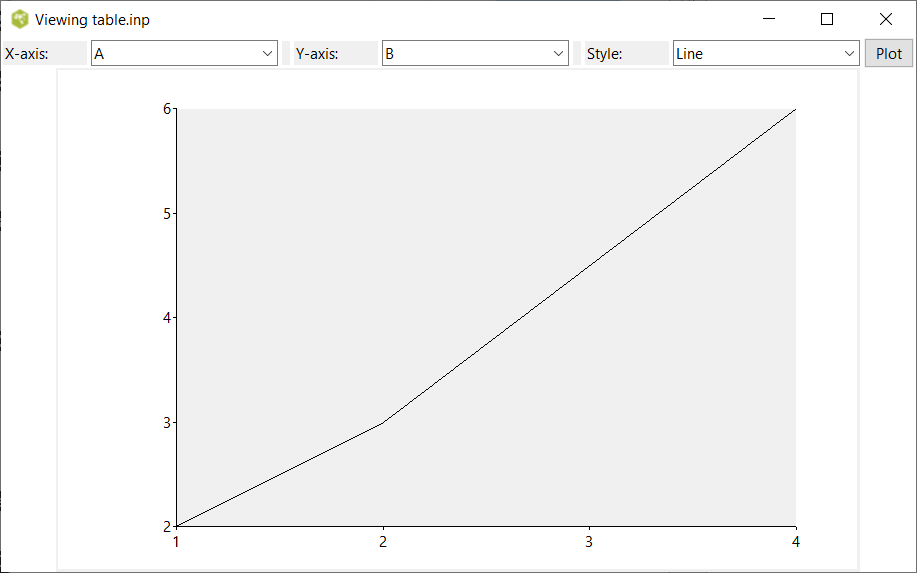
Here is an example, the data:
A        B       C
1        2       2
2        3       4
4        6       1
The plot (and GUI):