Smoothing a plot of noisy data via LOESS
Arjen Markus (23 february 2025) A small experiment with a statistical technique called LOESS, locally estimated scatterplot smoothing. I intend to include it in the math::statistics module of Tcllib. The idea is quite simple, though like in most statistical topics the devil is in the details: use data points around a chosen point to cancel out noise and get a smoother curve. The Wikipedia page on the subject explains in more detail.
Basically:
- For each point select a subset of data point that are "close" to it.
- Perform ordinary regression on this subset, the "best" line through the set.
- Estimate from that a new y value at that x coordinate.
- Repeat for all data points.
The result is a much smoother line that captures the underlying function.
Of course you need to specify some size of the subset, a fraction of the total data set, so that is one free parameter.
The code below implements the LOESS algorithm, so no weighing of the data points. It is a start.
# lowess.tcl --
#     Perform "locally estimated scatterplot smoothing" (LOESS) or
#     "locally weighted scatterplot smoothing"
#
#     Note:
#     LOWESS still needs to be implemented.
#
package require math::statistics

# loess --
#     Perform LOESS: result is a list of estimates of the dependent variable
#
# Arguments:
#     xvalues             The x-values (sorted in increasing order)
#     yvalues             The corresponding y-values
#     alpha               (Optional) fraction of the data points to be used
#                         per local estimate. (Default: 0.1, should be between 0 and 1)
#
# Result:
#     Local estimates for the y-values
#
proc ::math::statistics::loess {xvalues yvalues {alpha 0.1}} {
    variable TOOFEWDATA

    if { [llength $xvalues] != [llength $yvalues] || [llength $xvalues] == 0 } {
        return -code error -errorcode DATA -errorinfo $TOOFEWDATA $TOOFEWDATA
    }

    set number  [llength $xvalues]

    if { $alpha <= 0.0 || $alpha >= 1.0 } {
        return -code error -errorcode ARG -errorinfo "Alpha should be between 0 and 1" \
                                                     "Alpha should be between 0 and 1"
    }

    set samples [expr {int($alpha * $number)}]
    if { $samples < 2 } {
        return -code error -errorcode ARG -errorinfo "Alpha should be at least [expr {2.0/$number}]" \
                                                     "Alpha should be at least [expr {2.0/$number}]"
    }

    #
    # Per data point:
    # - Select the set of samples to be used
    # - Perform the linear regression
    # - Estimate the value according to that regression for the data point
    #
    # Since we expect the data to be sorted, we can simply use a sublist - no need to
    # collect the data in a more sophisticated way.
    #

    set estimates {}

    for {set i 0} {$i < $number} {incr i} {
        set first [expr {$i - $samples/2}]
        set last  [expr {$i + ($samples - $samples/2) - 1}]  ;# Make sure we N samples

        if { $first < 0 } {
            set correction [expr {0 - $first}]
            set first      0
            set last       [expr {$last + $correction}]
        }
        if { $last >= $number } {
            set correction [expr {$number - $last + 1}]
            set last       [expr {$number - 1}]
            set first      [expr {$first + $correction}]
        }

        set x       [lindex $xvalues $i]
        set xsubset [lrange $xvalues $first $last]
        set ysubset [lrange $yvalues $first $last]

        lassign [::math::statistics::linear-model $xsubset $ysubset] A B dummy

        lappend estimates [expr {$A + $B * $x}]
    }

    return $estimates
}
To see if it works, I used this test program:
# test_lowess.tcl --
#     Generate a data set with noisy data and perform
#     the LOESS or LOWESS regression. The test is that
#     the resulting curve looks like the nominal sine.
#
package require Plotchart

source lowess.tcl

pack [canvas .c -width 600 -height 600]
set p [::Plotchart::createXYPlot .c {0.0 10.0 2.0} {-3.0 3.0 1.0}]

$p dataconfig data -type symbol
$p dataconfig curve -colour red
$p dataconfig estimate -colour blue

for {set i 0} {$i < 100} {incr i} {
    set x [expr {$i/10.0}]
    set y [expr {sin($x) + 2.0 * (rand() - 0.5)}]
    set z [expr {sin($x)}]

    $p plot data  $x $y
    $p plot curve $x $z

    lappend xvalues $x
    lappend yvalues $y
}

set estimates [::math::statistics::loess $xvalues $yvalues]

foreach x $xvalues y $estimates {
    $p plot estimate $x $y
}
The result, for a particular run, was:
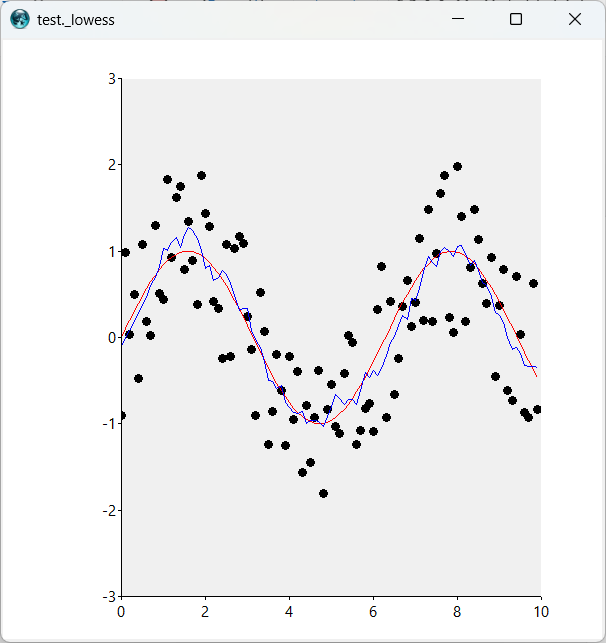
In this picture, the red line is the underlying curve without noise and the blue line is curve after smoothing via the given code. I used the default parameter value - use 10% of the total set.
Notes: This technique is mostly useful for enhancing scatter plots, though you could use the new y values for interpolation.
Also, the data need to be sorted in ascending order with respect to the x values. Otherwise selecting the various subsets would become more complex.