Swank Canvas Widget
Swankguy I've been in a flurry of work on the Swank canvas widget lately (to support features I need in software that uses it). Before I release the next version of Swank I wanted to organize my thoughts (and get feedback). This page summarizes some of the differences between this widget and the canvas widget in Tk (at least as compared to the last time I used it). Some, but not all of these features are in the current release.
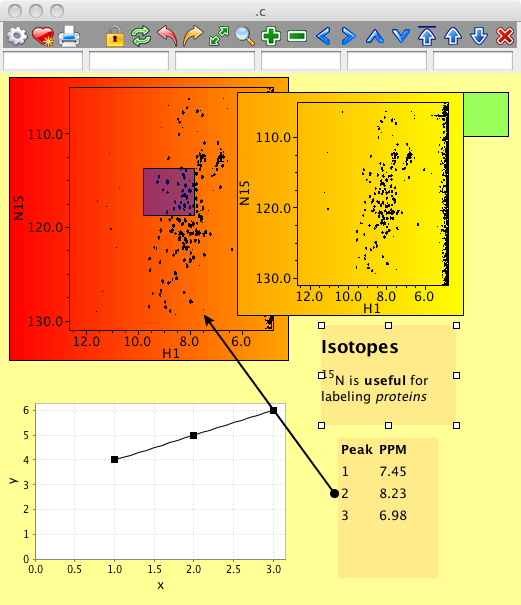
The image below illustrates some, but not all of the differences. The image is from the program NMRViewJ, written in Java and using Jacl and Swank. The NMR spectra are in custom canvas items, not part of the normal Swank distribution.
Colors
- Gradients: Some canvas items, such as rectangles, support gradient fills. The spectra in the example are basically transparent, but are here configured with gradient fills. Example: -gradient "0 0 red 1 0 orange"
- Textures: Some canvas items, such as rectangles, support textures (with images).
- Colors can be transparent. Example, -fill "255 255 0 128" (yellow with 50% opacity
Line End Points
- Lines can have a different style of endpoint at each end (arrow, square, circle, diamond, none).
Text
- In addition to normal text items, there are htext items. These support many HTML tags and some CSS styles (as implemented by Java Swing HTML endowed text widgets). The image shows one text item with an H2 header, superscripts, bold and italic text. The table item is a htext item layed out using HTML table tags.
Affine Transforms
- Item Transforms: All items can have an Affine transform associated with them. In the example below, the custom spectrum widgets generate what I refer to as "world" and "fractional" transforms. The transparent blue (looks purple on the red spectrum) rectangle has a "-transform world0" configuration. The coordinates are thereby set in terms of the internal coordinate system of the red spectrum. The green rectangle has a "-transform frac1" configuration. No matter where you move the red and orange spectrum items on the canvas the blue and green ones will stay in the same relative position.
- Zoom:the whole canvas has an Affine Transform associated with it, the scale of which is changed with the canvas "zoom" subcommand. This allows one to zoom the view in or out.
- shapexy and invshapexy subcommands can be used to transform between coordinates used by a specified shape and pixel positions of the canvas.
- -rotate: All canvas items support a -rotate configuration (in degrees).
Charts
- Charts: Charts are implemented using JFreeChart [L1 ]. In the Swank implementation they are essentially just another item that can be placed on the canvas. The chart shown, for example, is not implemented by using a bunch of individual canvas items, as would be done in Tk, but is instead a single chart item.
Handle Selection
- hselect command: All items can be selected using an "hselect" subcommand. Any items that are selected are displayed with selection handles (see the text item on example).
- Cursor indication: When the mouse enters a handle the cursor is changed to an "appropriate" resize cursor.
- Handles are not implemented as separate canvas items, but are fundamentally displayed by the underlying Java code. Moving and resizing selected items is the responsibility of "user code" and is not currently part of Swank (but is easily implemented).
- Tags: Items selected with "hselect" have an effective "hselect" tag.
Connectors
Connection lines between other canvas items are implemented with Swank Canvas Connectors
Scene graph
The Swank Canvas Scene Graph adds flexibility to the rendering of canvas items.
Also see Swank Canvas Widget Geometric Items where the additional canvas items symbols and segments are illustrated. Also this page shows that rectangles (and also, but not shown, ovals) can have text associated with them.
Another work in progress is Swank Canvas Widget Saving
The script to generate the above figure is here.
source ~/Development/NMRView/current/code/sandbox/objeditor.tcl
toplevel .c
NvSpectrumCBar .c

#jscrollpane .c.s
#pack .c.s -side top -fill both -expand y
canvas .c.c -bg "255 255 150" -width 612 -height 792
#.c.s add .c.c
pack .c.c -side top -fill both -expand y
.c.c newtype spectrum starfish.cvspectra.SpectrumShape 4

.c.c create spectrum 50 50 400 400
update
s.c.c.0 dataset test_0000.nv
s.c.c.0 commit

.c.c create spectrum 300 300  600 600
update
s.c.c.1 dataset test_0000.nv
s.c.c.1 commit

.c.c itemconfigure 0 -fill blue -gradient "0 0 red 1 0 orange" -tags "Spectrum anno"
.c.c itemconfigure 1 -fill yellow -gradient "0 0 orange 1 0 yellow" -tags "Spectrum anno"

set text {<html><h2>Isotopes</h2><sup>15</sup>N is <b>useful</b> for labeling <i>proteins</i></html>}
set table {<html><table> <tr><th>Peak</th><th>PPM</th></tr><tr><td>1</td><td>7.45</td></tr> <tr><td>2</td><td>8.23</td></tr> <tr><td>3</td><td>6.98</td></tr> </table> </html>}

.c.c create htext 40 40 140 80 -fill "255 0 0 20" -text $text -tags anno
.c.c create htext 240 240 340 380 -fill "255 0 0 20" -text $table -tags anno

.c.c create line 200 200 300 300  -fill black -width 2 -endstyle circle -startstyle arrow  -tags anno

.c.c create rectangle 9 110 7 115 -transform world0 -fill "0 0 255 100" -tags anno
.c.c create rectangle 1.0 0.0 1.2 0.2  -transform frac1 -fill "0 255 0 100"  -tags anno

::swank::chart::addToCanvas cFig  .c.c x y
plot "1 2 3" "4 5 6"
set item [.c.c find withtag plotFigcFig,1]
.c.c addtag anno $item
.c.c coords $item 0 400 300 600