Tcl based signal processing fundamentals: Practical Fourier Analysis
One of the main things signal processing persons will want, regardless of whether they want to do that in tcl, basic, C, matlab, mathematica/maxima, matcad, or some other (often interpreted) language + environment, is to be able to do a fourier analysis. I'm sure some pages on this wiki exist to do some of that, but this is supposed to be a fundamental and practical approach.
Important companions of this page, to understand the subject, and the tcl code, too, or because in my vision the subjects are relevant to a wide area of tcl signal processing (they also state why, usually) are:
- Tcl based signal processing fundamentals: Additive Wave Synthesis
- Tcl based signal processing fundamentals: Frequency Modulation
First, lets make a few one-liners to do signal frequency analysis, first a 256 (tcl-list) sample sine-wave (three wavelengths are fitted in the list in this case, so a third harmonic):
set twopi 2.0*3.1415926535
set r {}; for {set i 0} {$i < 256} {incr i} {lappend r [expr sin( (3.0/4.0)*$twopi + 3.0 * $twopi*$i/256)] }
To find a certain harmonic in the signal, we can use the well known fourier analysis, in this case in discrete form (multiplying the signal sample for sample with a certain harmonic component):
set t 0.0; for {set i 0} {$i < 256} {incr i} {set t [expr $t+ [lindex $r $i] * sin( 3.0 * $twopi*$i/256)] } ; puts [ expr $t/([llength $r] /2.0)]The third harmonic returns a 'strength' of 1 (full amplitude), then the 3.0 above is replaced by 1.0 for fundamental (1st harmonic) or another harmonic (smaller than 128) some number very close to zero (background numerical noise) is returned.
I'd rather make an application which does something like this [L1 ] (Click on the left on Waveform Lab, Theory, View Applet, Making Wavews, Sine f=2) in tcl/tk, but I want to do other things first, and I don't know if something like it already exists.
Lets first make sure we can get some of the important spectral lines from a tcl-list of samples, first, a fourier transform proc based on the above one-liner tries:
proc modfourier { {s} } {
    set r {}
    set twopi 2.0*3.1415926535
    for {set j 0} {$j < [expr [llength $s]/2]} {incr j} {
        set im 0.0
        set re 0.0
        for {set i 0} {$i < [llength $s]} {incr i} {set im  [expr $im+ [lindex $s $i] * sin( [expr $j * $twopi*$i/[llength $s]] )] };
        for {set i 0} {$i < [llength $s]} {incr i} {set re  [expr $re+ [lindex $s $i] * cos( [expr $j * $twopi*$i/[llength $s]] )] };
        lappend r [ expr sqrt($re*$re + $im*$im) / ([llength $s] /2.0)]
    }
    return $r
}
Mod is added to the proc name because the modulo is returned in the list of frequency components, and the phase is ignored.
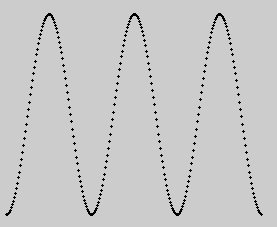
Using the tcl/tk code from Tcl based signal processing fundamentals: Additive Wave Synthesis the above graph of the wave was made.
So what's the big deal with this fourier analysis? That we can find frequency components in signals. In fact if we take all components from the above transform of a limited signal, we can find back the samples from that sampled signal by fourier synthesis (see page above), and it can be proven that the fourier basis (that is the sine and cosine components separately) can uniquely represent any signal as long as it has no frequency components higher than half the sample rate (harmonic 127 in the example). Mathematically speaking, the transform is then perfectly invertible. Wrt interpretation: the sine waves are like principal components for instance in a sound. Our ears mainly hear frequency components like these, though of course they vary with time, rather than sound pressure waves amplitude.
The above procedure isn't fast by algorithm or optimization. Probably the tcl code could be optimized by reusing variables and such, but mainly, most signal processing algorithms rely on what is called the Fast Fourier Transform, which does the same job as the above proc but reuses computed intermediate results using a smart (well known) mathematical rearrangement of the computations.
Now lets put the transform to work, we for instance use the above signal, stored as a tcl list of sampled values in variable r:
set i 0; foreach j [modfourier $r ] {if {[expr abs($j)] > 1e-9} {puts "$i $j"} ; incr i}3 0.999999999977
Listing only components larger than 1e-9 (1 in a billion, that's fairly accurate) we only get the expected frequency of 3 times the reciprocal sample length, which is fine.
A few more harmonics:
set s {} ;
for {set i 0} {$i < 256} {incr i} {
    set t 0.0;
    foreach {h a} {1 1 2 0.5 4 0.25} {
        set t [expr $t + $a*sin($h*$twopi*$i/256)]
    } ;
    lappend s $t
}
Testing:
set i 0; foreach j [modfourier $s] {if {[expr abs($j)] > 1e-10} {puts "$i $j"} ; incr i}1 1.00000000004 2 0.500000000018 4 0.250000000006
Beware this is not a fast fourier transform, you won't like it on a 75 MHz pentium, which runs tcl/tk just fine..
This reminds me of high-school where I'd make organ imitation waves like this in BASIC, which I would push into a DA converter with a machine language routine. Nowadays in principle snack could be used for the purpose.
Ok, so that looks fine thus far, too.
We should be aware of our statistics, self correlation margin, or measurement accuracy here: I only take integer harmonics into account, which is the best one can do on a limited interval, with no repeated (and averaged) harmonics measurements, so for instance a harmonics at one third of maximum shannon frequency (1/6th of the sample frequency) gives clearly an unclean spectrum.
Using these functions, I made a spectrum with a harmonic which is not an integer multiple of sample interval equivalent frequency:
plotlist             [additive [list 2 0.5 [expr 256.0/33] [expr 1.0/3] ]]
linelist [modfourier [additive [list 2 0.5 [expr 256.0/33] [expr 1.0/3] ]] ]
(When there is interest I can make the plot-routines available, see the above pages for the additive tcl function)
proc plotlist { {l} } {
    global mc
    set xp [llength $l];
    set xscale [expr 300/$xp];
    set yscale 100
    set pi 3.1415926535
    $mc del p;
    for {set i 0} {$i < $xp} {incr i} {
        plotpoint [expr 10+$i*$xscale] [expr 150-$yscale*[lindex $l $i]] 3
    }
}

proc linelist { {l} } {
    global mc
    set xp [llength $l];
    set xscale [expr 256/$xp];
    set yscale 100
    set pi 3.1415926535
    $mc del l;
    for {set i 0} {$i < $xp} {incr i} {
        plotline [expr 10+$i*$xscale] [expr $yscale*[lindex $l $i]]
    }
} 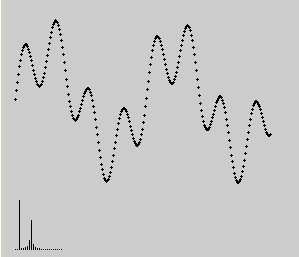
Imperfect Waveform and spectrogram
Because the approximation of the convolution integral in this case doesn't work to well, a single harmonic, which however doesn't fit int the sampled signal interval becomes a whole group of lines, with a maximum around the expected harmonics place in the spectrogram (with the above this can also be numerically checked).
The graph was made on a bwise canvas, though any Tk canvas is fine, as long as the tcl variable mc (for main canvas) contains its widget path name.
In many sound analysis programs, like snack these types of rather crude approximations appear all the time, and are somewhat improved by taking the average of more than 1 sample interval. It isn't a given what a fourier transform should do in general when a harmonic doesn't neatly fit in a sample interval, and people rarely take these cases properly into account. When the signal is seen as a perfectly sampled signal with a short piece of a certain harmonic, the theoretical results are different then when the sample could be made longer and the harmonic more properly captures, preferably when it becomes a multiple of the sample interval wavelength corresponding frequency. In the latter case it can be perfectly detected as single spectral line. In the former case, sampling theory, which normally would like us to take the signal a s piece from an infinitely repeating signal, will tell us that the spectrum of the non-fitting harmonic in a limited time interval contains infinite harmonics, as a consequence of a jump or discontinuity, and therefore the sample cannot even be taken to uniquely stand for one signal, and may indeed as far as fourier analysis is sensible have a unclean spectrum.