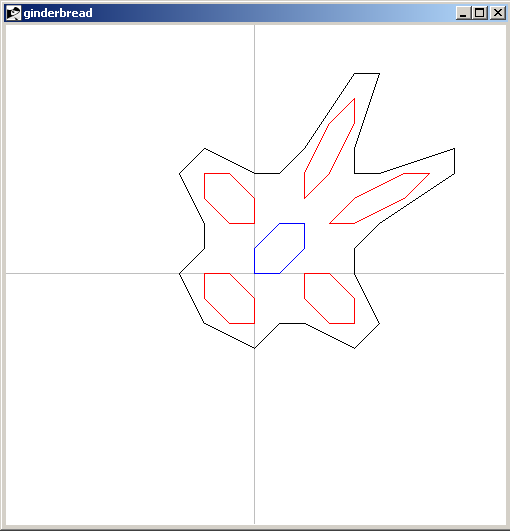
gingerbread man
Arjen Markus (22 january 2010) The other day I came across the Gingerbreadman Map [L1 ], a surprisingly simple two-dimensional map that shows regions of chaotic behaviour. That is, if you repeatedly apply the map to adjacent points, they end up in completely different parts of the plane after a number of iterations.
The map is defined in this way:
    xnew = 1 - y + |x|
    ynew = x
Since the map is piece-wise linear, line pieces will remain line pieces (though they might be broken up). To get a better idea of how it works, I wrote the program below. Enjoy!
# gingerbread.tcl --
#     Draw the gingerbreadman map - or at least parts of it
#

# mapLine --
#     Repeatedly map a line piece using the gingerbreadman map
#
# Arguments:
#
#     n          Number of mappings
#     x1         X-coordinate of first point
#     y1         Y-coordinate of first point
#     x2         X-coordinate of second point
#     y2         Y-coordinate of second point
#     colour     Colour of the line
#
# Result:
#     None
#
# Side effect:
#     New line drawn on canvas
#
proc mapLine {n x1 y1 x2 y2 {colour black}} {

    .c create line $x1 $y1 $x2 $y2 -fill $colour
    for { set i 0 } { $i < $n } { incr i } {
        lassign [mapGinger $x1 $y1] x1 y1
        foreach [mapGinger $x2 $y2] x2 y2

        .c create line $x1 $y1 $x2 $y2 -fill $colour
    }
}

# mapGinger --
#     Map the coordinates
#
# Arguments:
#     x             X-coordinate
#     y             Y-coordinate
#
# Result:
#     List of the new coordinates
#
proc mapGinger {x y} {

    set xnew [expr {1.0 - $y + abs($x)}]
    set ynew $x

    return [list $xnew $ynew]
}

# main --
#     - Set up the canvas
#     - Draw several line pieces
#     - Rescale
#

pack [canvas .c -bg white -width 500 -height 500]

.c create line -10.0   0.0  10.0  0.0 -fill grey
.c create line   0.0 -10.0   0.0 10.0 -fill grey

mapLine 30  1.0 -2.0  2.0 -2.0
mapLine 30  3.0 -2.0  4.0 -2.0 red
mapLine 30  0.0  0.0  1.0  0.0 blue
#mapLine 30  0.0 -3.0  1.0 -3.0 red
#mapLine 30  0.0 -3.1  1.0 -3.1 blue
#mapLine 30  0.0 -2.9  1.0 -2.9 green

.c scale all   0    0  25  -25
.c move  all 250  250
Here is the result: