moodss
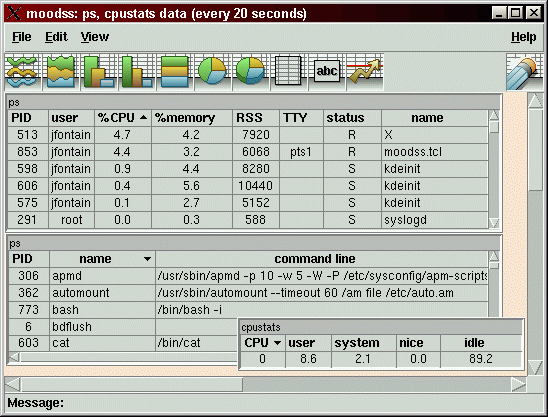
moodss an acronym for 'Modular Object-Oriented Spreadsheet , by Jean-Luc Fontaine, is a graphical monitoring application. It is modular so that the code accessing the monitored objects is completely separate from the application core. The core takes care of managing modules (loading and unloading), displaying modules data through sortable tables and diverse graphical viewers, handling user set threshold conditions with email alerts, recording and browsing data history from a database.
moodss can even predict the future, using sophisticated statistical methods and artificial neural networks, and therefore be used for capacity planning.
Screenshots


Attributes
- name
- moods
- website (old)
- http://jfontain.free.fr/
- current version
- 21.5
- contact
- j f o n t a i n at f r e e dot f r (Jean-Luc Fontaine)
Response
"The code is polished, mature, and considered an exemplar in the Tcl community."
- Eric S. Raymond, The Art of Unix Programming ,2003
YekSoon: Moodss must be one of the most frequent released and updated Tcl apps around.
LV: And each release provides invaluable new features, as well as increasing quality. what a jewel it is!
Download
Press
- Moodss — Modular Administration ,Jon Holman ,2002-09
- Moodss: when capacity planning becomes a must ,Flavio Villanustre 2005
- Moodss for Monitoring ,Joe Barr ,2003-11-07
Documentation
Description
The Modular Object Oriented Dynamic SpreadSheet (moodss) package is implemented in Tcl/Tk 8 and displays tabular data defined in independant modules. Complete help is provided.
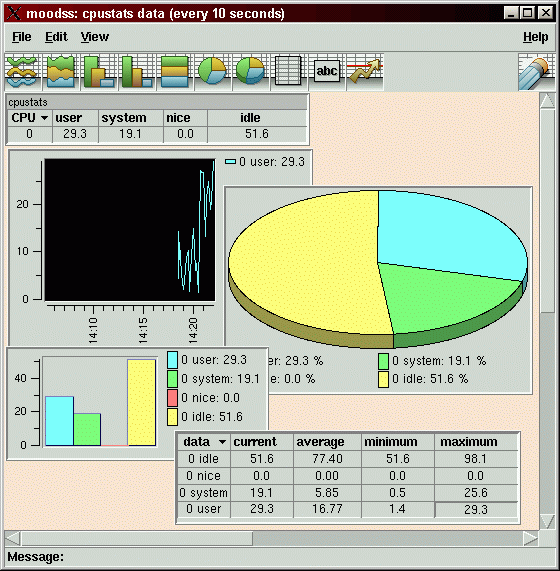
Visualizations:
- graphs
- side and stacked bar charts
- 2 and 3d pie charts
- summary tables
- changing icons
Interactivity:
- supports multiple element drag and drop
- multiple module concurrent support
- help
- summary tables
features:
- print previewing via ghostscript
- Uses Tcl/Tk 8.3.1
- tkTable 2.x
- tkpiechart 5.2
- BLT 2.4i
modules (Some modules are provided as examples which show off visualizations):
- apache/apachex
- arp
- cpustats
- core trace
- diskstats
- interrupts
- kernmods
- log
- memstats
- minimal
- moomps (Modular Object Oriented MultiPurpose Service - a monitoring daemon)
- Currently at version 5.8:
- mounts
- various MySQL stats
- minipy
- randpy Python modules
- netdev
- odbcquery
- pci
- (nmicmpd) pinging daemon
- ps
- random
- route
- sensors
- SNMP/snmptrap
- system modules for Linux
- trace modules
And etc. It can even keep track of all of this info on multiple servers. Supports use of ssh for secure remote invocations. Modules can be written in Tcl, Perl, Python, or C. Complete HTML documentation is also included. Tested with Unix and Windows 95. A Redhat rpm with moodss, BLT, and TkTable is available.
I think this tool would be a good replacement for all those top-like graphical utilities in Linux distributions. Linux moodss modules already cover CPU, disk, memory, network devices statistics, ARP, kernel modules, PCI devices, mounted filesystems, processes, system data and routes, locally or remotely through ssh.
Change Log
Note that moodss is constantly moving forward: I have recently added the capability of storing history data with the associated moomps daemon in a SQL database.
We use that feature at work to monitor the traffic on 2 dozen WAN lines every day (1 sample per minute). A co-worker very quickly wrote a PHP page to display the data in a graph: it works like a charm (the MySQL database spits out a whole day data in 0.03 seconds!).
The whole setup took a couple of days, including Linux installation on a spare machine. That system is now used in production.
The next moodss release will allow browsing the database from the GUI, in a similar manner as real-time data is accessed.
Jean-Luc
Jean-Luc Fontaine 2003-06:
Here is an update on how I use moodss/moomps, as of june 2003:
I use moodss at work to monitor 22 remote computing sites. Each site is connected to the main site, where the management Linux server (Red Hat 9) sits, by a WAN line, and each site contains a UNIX AIX server. Network trafic (in and out), CPU usage (system, user and input/output and usage for 5 specific families of applications), memory usage (total, swap input/output, and usage for each applications family) are periodically sampled (every minute or 5 minutes for the applications). All those data samples, collected 24 hours a day, 7 days a week, are stored in a MySQL database (4.0 series via mysqltcl). All the data is processed and stored by the moomps daemon, using SNMP (snmp module) and AIX specific modules. So far, tens of millions of samples have been stored, with the history database table being split in several tables (1 per month). Finally, data is made available to the users via dynamic web pages (in PHP with jpgraph) with daily graphs. The Linux server is a bi-processor (2 x 1.25 GHz Pentium III, 1 GBytes of memory), with a SCSI disk and a big IDE disk for daily backups).
Note: this is using Tcl/Tk 8.3.5, next step being moving to the 8.4 series.
Another update on moodss in the real world:
Still monitoring 22 remote computing sites. Around 180 million data samples have been recorded by moomps so far. Moved to Tcl/Tk 8.4.6 and a bi-Xeon 2.4 GHz machine (which really gives 4 processors with hyper-threading enabled and Linux 2.4).
Thresholds have been setup so that emails are sent to a bunch of people when WAN lines go down, on backup and up again. Next, 44 Windows 2003 servers will also be monitored, which should push the collected data rate to more than 20 million samples per month. Linux kernel 2.6 will be used to gain 10 to 20% performance on the MySQL database server.
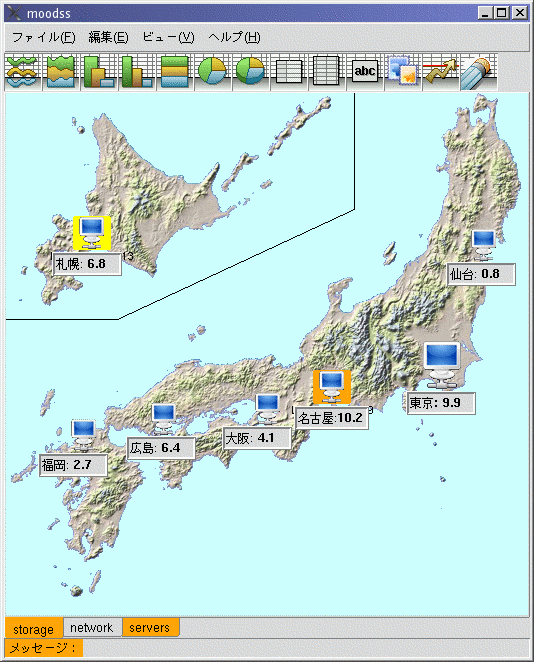
And I almost forgot, the GUI has been fully localized: French and Japanese are available. Many thanks to Jeff Hobbs and other people who made that feature work (even Japanese input) flawlessly!
The recent major improvements include the ability to combine data cells into mathematical expressions and display them in "formulas" tables, the data cells of which can in turn be used like any other data cell, for graphing, thresholds, database archiving, ... Note that any data cell from any module, including from another formulas table, can be included in a formula.
The new "nagios" module can use any compatible nagios plugin, thereby augmenting the number of moodss compatible modules to about one hundred. Note that the nagios module automatically sets standard (in the nagios sense) thresholds based on the returned status of the plugin (green, orange and red states).
The next major release will allow distributed monitoring a la p2p, using a new "peer" module. In the simplest case, a moomps deamon could collect the monitored data and export it to a number of moodss viewing clients, using the peer module in import mode. Later, peer modules running anywhere will be able to gather the monitored data from the closest or fastest "peer" neighbour.
Note that since peer modules will be modules in their own right, their data cells can be used for graphing, formulas, thresholds, ...
Another update on moodss in the real world: now also monitoring QOS and Ethernet ports on intelligent switches spread all over the network, which results in the moomps deamon storing about 50 million records a month... When monitoring Windows servers is added, I am aiming at the 100 million/month mark. Because of the load on the MySQL server, a double double-core 64 bit AMD server with 32 GB of RAM and RAID 0 will be installed.
The major new feature planned and being worked on is... predicting the future. With the help of the R project statistical engine (a remarkable piece of software), the user will be able to receive emails such as: "the disk on server S... is likely to become full in 3 weeks". The statistical model will be automatically determined by moodss in the new predictor viewer, from traditional models (ARIMA, ...) and neural networks... Expect the new release by the end of 2005.
Misc
LV: Anyone written a dtrace visualization module for moodss?