Version 3 of chesschart
Updated 2020-11-08 09:13:35 by DDGName
chesschart - widget to create flowcharts using chess coordinates.
Description
DDG 2020-11-08: chesschart is a snit widget based on the Tk canvas widget to create nice flowcharts using standard chess coordinates.
Links
- Homepage: https://github.com/mittelmark/DGTcl
- Download: https://github.com/mittelmark/DGTcl/tree/master/lib/chesschart
- Manual: http://htmlpreview.github.io/?https://github.com/mittelmark/DGTcl/blob/master/lib/chesschart/chesschart.html
- Version: 0.1 - 2020-11-08
- License: MIT
Example
Below a simple example to create timeline flowchart
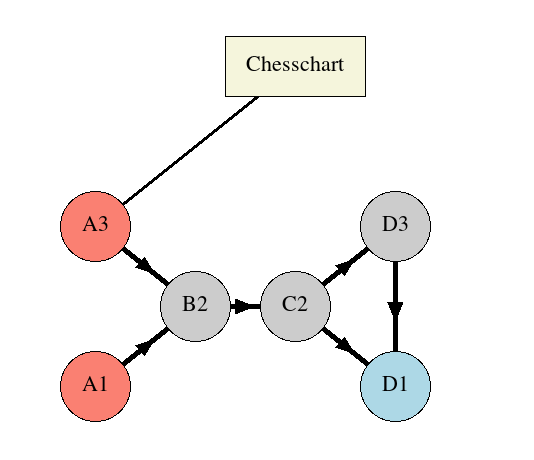
package require chesschart
set demo [chesschart .chart -background white]
pack $demo -side top -fill both -expand true
$demo rect C5 -text "Chesschart" -width 140 -height 60 -color beige
$demo oval A3 ;# default -text is coordinate, default -color is salmon
$demo oval A1 ;# with -text string you can overwrite the text, etc.
$demo oval B2 -color grey80
$demo oval C2 -color grey80
$demo oval D3 -color grey80
$demo oval D1 -color "light blue"
$demo arrow A3 B2 -width 5
$demo arrow A1 B2 -width 5
$demo arrow B2 C2 -width 5
$demo arrow C2 D3 -width 5
$demo arrow C2 D1 -width 5
$demo arrow D3 D1 -width 5
$demo line C5 A3
# standard canvas commands still work
$demo move all -20 -400
Image
Below is an image of the running application.
See also
- snidgets (Snit widgets)
Discussion
Please discuss here ...