Analysing geographical data with NAP
Arjen Markus (30 june 2007) Geographical maps fascinate many people, but besides being pretty geographical maps, especially thematic maps, also serve another purpose: you can use them to analyse, say, the impact of a new airport strip on the living conditions of the people who live in the neighbourhood. Or, as is shown below, to estimate the number of people who could be hit by noxious smoke from an accident in a chemical plant.
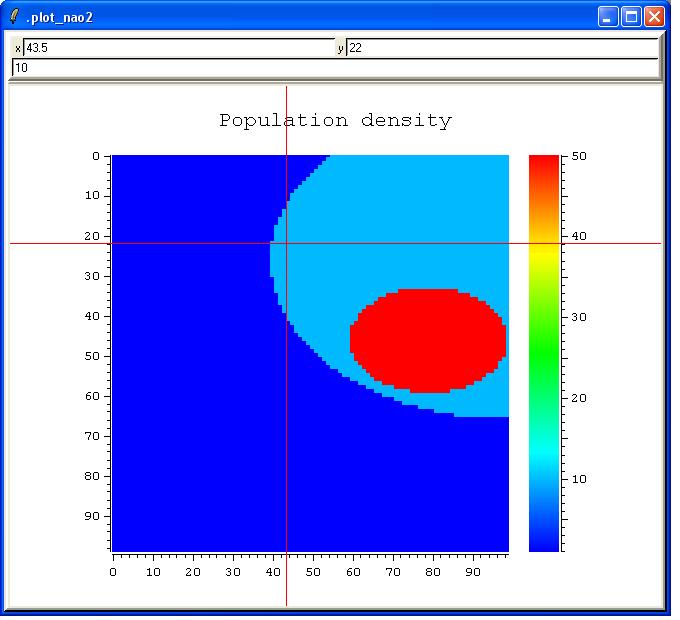
With this hypothetical example I want to show how such an analyis could be done with Tcl and the NAP extension. It starts with a map of the population in an area of 50 by 50 km:
- There is a city with a fairly high density (50 people per km2)
- There is an area around the city with a medium density (10 people per km2)
- The rest of the area has a very low density (1 person per km2)
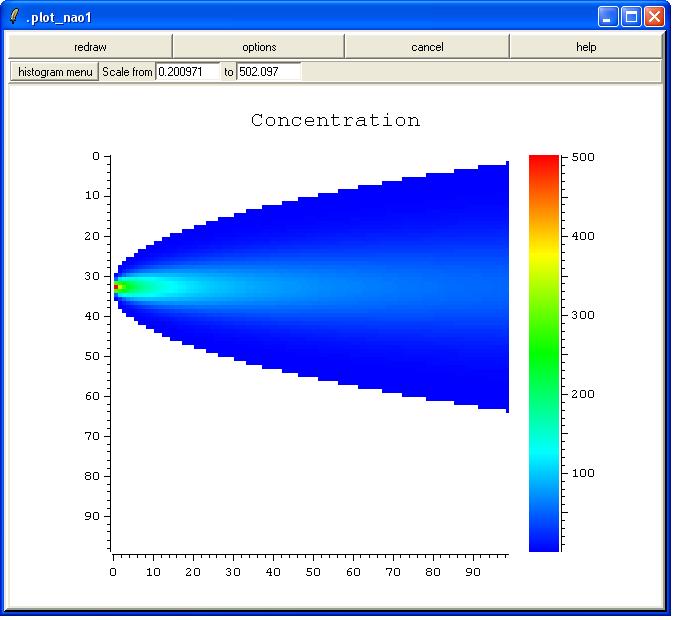
The chemical plant, located in the west, suffers an accident and produces a continuous discharge of smoke. If the concentration is higher than a certain threshold, you may find it irritating to breath the air. For the distribution of the smoke down wind we assume a simple Gaussian distribution (the simplest mathematical model possible).
The aim is now to find out how many people in this area will suffer from the smoke.
The analysis deals with data on a rectangular grid. Simply put:
- Make a map (matrix) of the population density
- Make a map of the concentration
- Check all the grid cells where the concentration is above the threshold
- Multiply these grid cells with the number of people living there
- Sum over all the grid cells
- For a bonus: visualise the data
A few notes:
- Syntax errors in procs like linearx that are used as NAP function
are not reported as errors in the procedure itself, but as an error in the way the function is called. This is rather awkward if you are not aware of it
- Procedures that are used as functions get arguments in the form of
NAOs. That is why in linearx for instance the shape is constructed as:
{[$nx] [$ny]} # gis_analysis.tcl
# Use NAP for analysing the impact of a plume of smoke on a
# populated area
#
package require Tk
package require nap
namespace import NAP::*
# linearx --
# Construct the x-coordinate of a rectilinear grid
#
# Arguments:
# nx Number of cells in x-direction
# ny Number of cells in y-direction
# xmin Minimum x-coordinate
# xmax Maximum x-coordinate
#
# Result:
# 2D array with x-coordinates
#
# Note:
# We need to deal with the reference count of the returned
# NAO (NAP data object) as the local variable that holds it
# will cease to exist when the procedure returns
#
proc linearx {nx ny xmin xmax} {
nap "xstep = (xmax-xmin)/(nx-1)"
nap "x = xmin + xstep * (0 .. nx-1)"
nap "x = reshape(x, {[$nx] [$ny]})"
$x set count 2 -keep
return $x
}
# lineary --
# Construct the y-coordinate of a rectilinear grid
#
# Arguments:
# nx Number of cells in x-direction
# ny Number of cells in y-direction
# ymin Minimum x-coordinate
# ymax Maximum x-coordinate
#
# Result:
# 2D array with x-coordinates
#
proc lineary {nx ny ymin ymax} {
nap "y = transpose(linearx($nx,$ny,$ymin,$ymax))"
$y set count 2 -keep
return $y
}
# uniform --
# Construct a grid with a unform value
#
# Arguments:
# nx Number of cells in x-direction
# ny Number of cells in y-direction
# value Value to be used
#
# Result:
# 2D array with a uniform value
#
proc uniform {nx ny value} {
nap "v = reshape(($nx*$ny)#$value, {[$nx] [$ny]})"
$v set count 2 -keep
return $v
}
# fillCircle --
# Fill cells in an existing grid that lie within a given circle
#
# Arguments:
# grid Grid to be partially filled
# x X-coordinate of the grid points
# y Y-coordinate of the grid points
# xcentre X-coordinate of the centre of the circle
# ycentre Y-coordinate of the centre of the circle
# radius Radius of the circle
# value Value to be used
#
# Result:
# 2D array with a filled-up area
#
proc fillCircle {grid x y xcentre ycentre radius value} {
nap "v = (hypot(($x-$xcentre),($y-$ycentre)) < $radius)? $value : $grid"
$v set count 2 -keep
return $v
}
# gaussian --
# Create a matrix containing a Gaussian plume
#
# Arguments:
# x X-coordinate of the grid points
# y Y-coordinate of the grid points
# xorig X-coordinate of the origin of the plume
# yorig Y-coordinate of the origin of the plume
# disp (Transversal) dispersion rate
# wind Wind velocity
#
# Result:
# 2D array with a plume in positive x-direction (unscaled)
#
proc gaussian {x y xorig yorig disp wind} {
# 1 -y**2/(Dx/u)
# ----- e
# sqrt(2piDx/u)
#
# x given in km, hence a factor 1000
nap "pi = 4.0*atan(1.0)"
nap "v = (1.0/sqrt(2.0*pi*disp*x/wind)) * exp( - y*y/(disp*x*1000.0/wind) )"
$v set count 2 -keep
return $v
}
# classes --
# Fill in values for each class
#
# Arguments:
# matrix Matrix with class numbers
# values Values to fill in per class
#
# Result:
# 2D array with values filled in
#
proc classes {matrix values} {
set classno 0
nap "result = matrix"
foreach value [$values value] {
nap "result = (matrix == classno)? value : result"
incr classno
}
$result set count 2 -keep
return $result
}
#
# Set up the map with the population
#
set nx 100
set ny 100
nap "x = linearx($nx, $ny, 0.0, 50.0)"
nap "y = lineary($nx, $ny, -25.0, 50.0)"
nap "population = uniform($nx, $ny, 1)" ;# Very low density
#
# Fill in the urban and suburban areas
#
nap "population = fillCircle($population, $x, $y, 50.0, -5.0, 30.0, 2)"
nap "population = fillCircle($population, $x, $y, 40.0, 10.0, 10.0, 3)"
#
# The plume of smoke
#
nap "conc = 40.0 * gaussian($x, $y, 0.0, 0.0, 10.0e-3, 5.0)"
#
# Which cells have a "high" concentration?
#
nap "irritating = conc > 0.2"
#
# Compute the number of people that will suffer:
# - Mark the cells with a high concentration (simply: value of
# irritating times the type of population density)
# - Count the cells per category (via the unary tally operator #)
# - Multiply each category with the number of people per cell
# - Sum all categories
#
nap "influenced = #reshape(irritating*population,{[expr {$nx*$ny}]})"
set area_per_cell [expr {50.0*50.0/($nx*$ny)}]
nap "casualties = sum( influenced * {0 1 10 50} * $area_per_cell )"
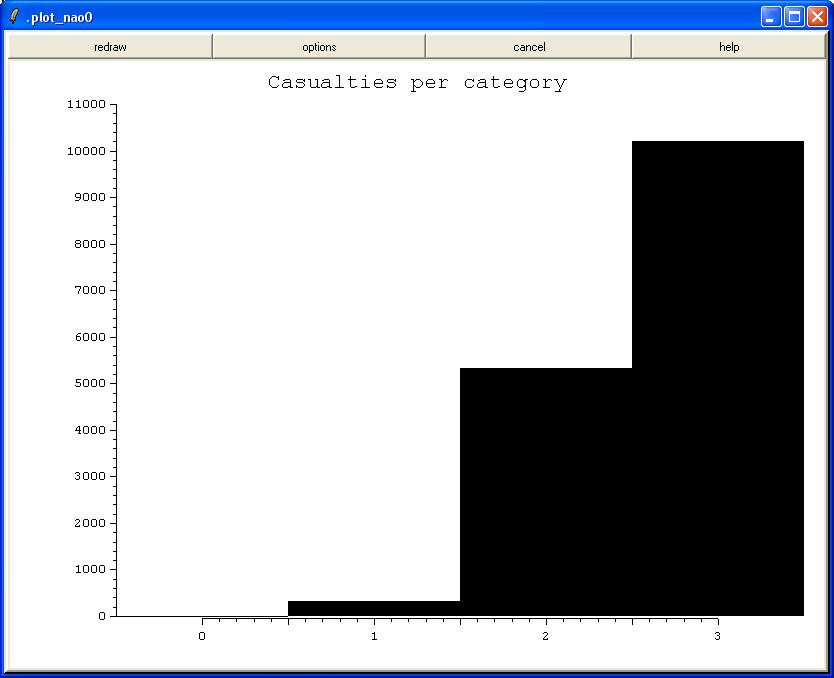
nap "casualties_per_category = influenced * {0 1 10 50} * $area_per_cell"
catch {
console show
}
puts "Number of casualties: [$casualties value]"
puts "Per category:"
puts "Category\tNumber\tArea:"
set values [lrange [$casualties_per_category value] 1 end]
set influenced_area [lrange [$influenced value] 1 end]
foreach c {Low Medium High} v $values a $influenced_area {
puts "$c\t\t$v\t[expr {$a*$area_per_cell}]"
}
#
# Now some pictures
# Note:
# We have not defined any coordinates for the 2D datasets ...
#
plot_nao casualties_per_category -type bar -title "Casualties per category"
plot_nao [nap "conc>0.2? conc : _"] -title "Concentration"
plot_nao [nap "classes(population,{0 1 10 50})"] -title "Population density"Here are the pictures:
See also Analyzing Remote Sensing Data with NAP