Enhanced 3D Plot Examiner for functions of 2 variables
uniquename - 2012dec15
On my 'bio' page at uniquename, I have pointed out that I found the 3D model viewing programs of MBS = Mark Stucky (3dviewer : A canvas only viewer of 3D data) and GS = Gerard Soohaket (3D polyhedra with simple tk canvas) quite inspiring --- especially since I was surprised that one can rotate 2D projections of 3D models consisting of many hundreds of facets in 'real time' using 'plain vanilla' Tcl-Tk (no OpenGL required) --- using the 'create polygon' facility of the Tk canvas.
I have started to make some headway on similar viewers --- with enhanced 3D model import options and some other enhancements. However, before I get involved with a lot of 3D file format issues, I thought I would take on a slightly less ambitious project that would allow me to get some experience with rotating 3D model data.
In searches on wiki.tcl.tk for keywords like '3D', I ran across the page 'Viewer for functions of two variables' [L1 ] by AM (Arjen Markus), 2003 May.
I tried out his script and its performance indicated that it should be possible to use Tcl-Tk to do plots of 3D functions involving hundreds or even thousands of data points, projected onto a Tk canvas as polygons, within a second for each complete plot.
Here is an image of the demo plot from AM's 'view3d.tcl' script.
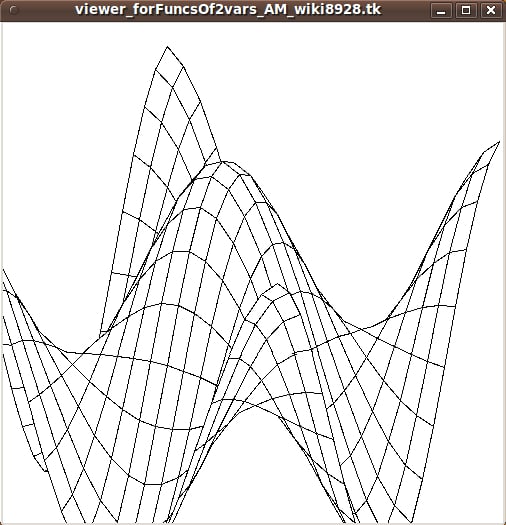
It is not apparent from this static image that AM provided an 'animated' 3D plot.
AM animated the plot view with an oscillating view vector. He used a 10 millisec pause at the end of each plot, before starting the rotation-projection calculations and 'create polygon' commands for the next plot.
One thing that IS apparent from the static image is that you can see that AM did not provide any widgets on this GUI for entering functions, specifying the rectangular grid on which the function is evaluated, controls for the rotation, etc. etc.
In fact, Arjen Markus (AM) wrote:
"This is just another one of those little applications that may come in handy sometimes. Though it is not as flexible as it probably should be --- no facilities for entering the expression in a GUI, no adjustment of the scaling nor of the viewpoint --- still it can be a useful tool or the starting point of one."
MM (Marco Maggi) responded to AM's comment and provided another Tcl-Tk script, on that same page, that included facilities that AM mentioned. I ran MM's script on my Linux machine and captured the following image.
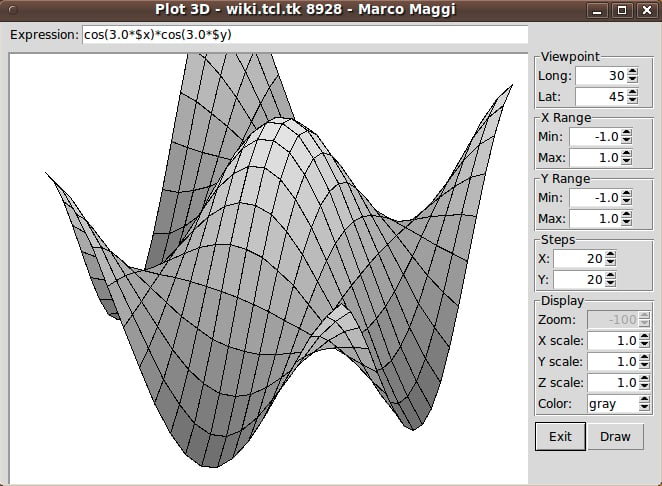
(I moved the entry field for the function f(x,y) to the top of the GUI, so that I could capture a smaller image with the entry field showing.)
You can see that MM provided about a dozen GUI widgets to make a Tk script that is quite a bit more useful, without the user having to edit the Tk script. Some of the widgets he added:
   - MM provided a 'Draw' button to do the redraw after any changes via
     the widgets he provided.

   - MM added a function entry field and some control capabilities (mostly via
     spinboxes) --- such as adjustment of viewpoint (via longitude and latitude
     angles), xy domain setting (min,max), xy grid setting ('steps'), and
     some xyz scaling.
I found that keeping the function projection within the canvas (without distorting the plot) to be a rather slow, multi-step process with the MM script.
It seems the way to do that (and not distort the plot) is to change the x, y, and z scales equally, via 3 spinboxes and then click the 'Draw' button.
This is rather tedious and slow. In fact, by providing the 'Draw' button as the ONLY way to redraw the plot after a change (esp. a viewpoint change), it is impossible to rotate the plot quickly and smoothly --- and thus investigate quickly whether the code is showing the surface correctly (esp. the hidden polygons) no matter the 'view point'.
Furthermore, color control in the AM and MM scripts was rather sparse.
AM's function display was a wireframe --- black lines on a white background.
Although MM added some gray-shading of the polygons, there was no control of canvas background color and very little control of the color of the polygons. MM provided 3 color options - gray, white, green - with shading provided in the gray case, based on z-height, NOT light source and angle of polygons to the light source.
Also, MM did not provide an option to turn off the wireframe (polygon outlines).
---
THE MATH:
The biggest problem that I had with the AM and MM scripts is that they did not document some of the critical mathematical expressions that they were using.
After a significant amount of web searching and book searching, I could not find similar formulas to ones used by AM & MM --- for example, for translation, rotation, and 2D projection.
In fact, after much web searching and book searching, I couldn't find ANY decent COMPLETE presentation of formulas for projecting 3D points in xyz-space onto a viewing plane determined from a given view direction (given by longitude and latitude angles) --- especially a presentation that applied fairly directly to this application --- plotting of a function f(x,y) or a surface of that type.
There are, of course, general presentations of rotation matrices in various books on 3D CG (computer graphics), but I could not find a presentation that applied a general presentation to a more specific case like rotating and projecting a 3D-plot of a function of 2 variables. Most presentations gave an extremely cursory treatment of going from a 3D rotation to a 2D projection, if any presentation at all.
Rather than trying to use the AM or MM formulas and their approach (that were hard for me to 'crack'), I decided to derive an approach and set of formulas myself. If I could do so, then I would understand the formulas and their application methods and limits much better.
---
MY GOALS:
I decided to make a similar utility to the AM-MM 3D plot utility --- but with more complete documentation of the methods used --- and with a few added 'bells and whistles'. Here are some features of my script versus the MM script.
1) ROTATION METHOD:
MM allowed the user to specify latitude and longitude angles to specify the view direction. I do the same.
However, instead of spin-boxes, I use Tk scales so that setting the 2 view angles can be done more quickly and redraw is more immediate. I use button1-release bindings on the scales to cause the redraw as soon as a scale change is complete.
(I may eventually add bindings to mouse events on the canvas, like <Motion>, so that the view rotation can be done even more quickly & conveniently. This would be similar to rotate/zoom/pan controls that Mark Stucky provided in a 3D model viewer that he published at wiki.tcl.tk/15032.)
2) FUNCTION ENTRY:
In addition to having an entry field for the function f(x,y), I added a listbox of sample functions on the left of the GUI. Clicking on a line in the listbox puts a function in the entry field.
This provides a way of providing some interesting functions that a user can quickly try (and alter), instead of the user spending time trying to think of functions to try.
By using the listbox with scrollbars, an essentially unlimited number of interesting functions could be supplied eventually.
3) COLOR CHOICES:
I allow color choices for the
- polygon fill
- polygon outline
- canvas background
from among 16 million colors, each.
4) DISPLAY OPTIONS:
I provide 3 radiobuttons by which polygon fill, outline (wireframe display on the canvas background color), or both (fill and outline) can be specified.
5) ZOOM OPTION:
I provide a 'zoom' Tk scale widget, by which the plot can easily be resized, down or up --- to make sure the entire plot can be seen on the canvas. Like with the 2 scales for the longitude-latitude view angles, I use a button1-release binding on the zoom scale to cause the redraw as soon as a scale change is complete.
6) MATH APPROACH:
I have derived a set of formulas based on a Ry * Rz rotation matrix approach where Rz is a (longitudinal or 'yaw') rotation about the 'global' z-axis that is applied to each 3D point (x,y,z=f(x,y)) --- and then Ry is a (latitudinal or 'pitch') rotation about the 'global' y-axis --- where z is up, y is to the right, and x is out of the screen. (No 'roll' around the x axis ... too disorienting. That is for fighter jet simulations and for emulating a modern cork-screw, turn-me-upside-down roller coaster ride.)
I may publish a discussion of the mathematical details, complete with illustrative diagrams, on another wiki.tcl.tk page --- since such discussions seem so hard to find. (I challenge anyone to find a discussion that applies directly and completely to this application --- and that takes you right up to the point of providing pseudo-code.)
The derivation/walk-thru has been instructive to me. The concepts and techniques will probably be useful for other 3D Tk-script projects --- such as viewing of terrain surfaces and examining 3D models (composed of triangular polygons).
---
In aiming to accomplish these goals, I ended up with the GUI seen in the following image.
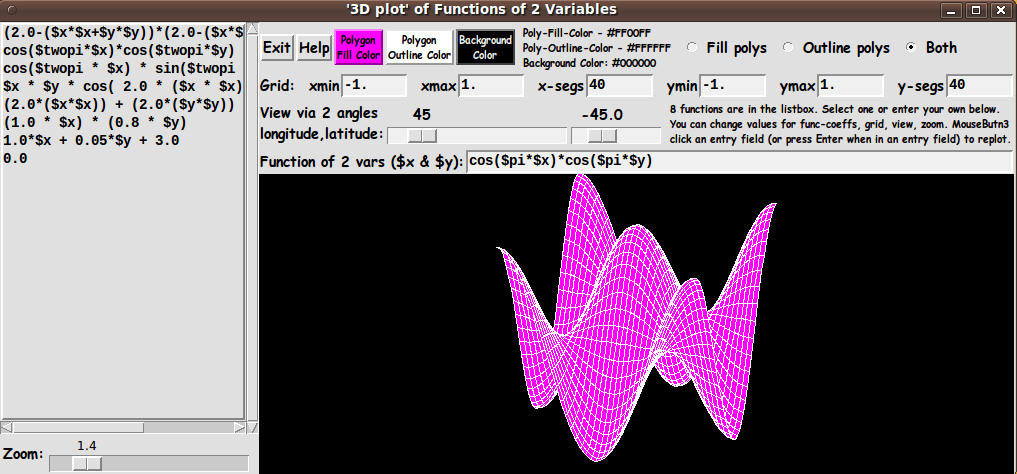
In this image, you can see the three buttons for color-setting, across the top of the GUI --- 'Fill', 'Outline', and 'Background'.
To the right of the color-setting buttons, you can see the fill/outline/both radiobuttons, which are used to basically allow for switching between a 'wireframe' display and an opaque-color display.
The next frame down contains the 'Grid' entry fields --- for xmin, xmax, x-segs, ymin, ymax, and y-segs.
And the next frame contains the 2 scales for the longitude and latitude rotation angles.
And below that frame is the entry field for the function f(x,y).
The 'Help' button shows the following text. It describes the various ways in which a 'draw' is triggered.
HELP for this 3D f(x,y) Function Plotting Utility
SELECTING/ENTERING A FUNCTION:
When the GUI comes up, you can use the listbox to select a function, f(x,y), to plot. Use MouseButton1 (MB1) click-release to put a function in the function entry field. The function will be immediately plotted in the canvas area.
Alternatively, you may enter a function of your own choosing in the 'function-entry-field'. The main rule to observe is to use '$x' and '$y' to represent x and y. And, of course, you should compose a syntactically-correct math expression that is to be evaluated at each x,y location on a rectangular grid of x,y coordinates.
---
CHANGING A FUNCTION:
You can change coefficients in a function or the formulation of the function, in the entry field. To re-plot the new function, you can press the Enter key --- or to re-plot at any time, you can MB3-click-release on the 'function-entry-field'.
---
ALTERING THE GRID:
You can change the grid parameters --- xmin,xmax,x-segs, ymin,ymax,y-segs --- by entering new values. To re-plot based on the new grid, you can press the Enter key in any grid entry field --- or to re-plot at any time, you can MB3-click-release on any of the 'grid-entry-fields'.
---
CHANGING THE VIEW ANGLE:
You can use the two 'angle-scale' widgets to quickly change either of a couple of rotation angles --- longitude and latitude.
An MB1-release of the slider on an angle-scale widget causes a replot.
You can simply keep clicking in the 'trough' of either scale widget (to the left or right of the scale button) to step through a series of re-plots, varying an angle one degee per click-release.
---
ZOOMING:
You can use the 'zoom-scale' widget to magnify or shrink the plot.
An MB1-release of the slider on the zoom-scale widget causes a replot.
Click in the 'trough' --- on either side of the scale's button --- to zoom in/out a little at a time.
---
FILL/OUTLINE/BOTH:
The fill/outline/both radiobuttons allow for showing the plot with the polygons (quadrilaterals) color-filled or not --- and with outlines ('wireframe' mode) or not.
---
COLOR:
Three COLOR BUTTONS on the GUI allow for specifying a color for
  - the interior of the polygons
  - the outline of the polygons
  - the (canvas) background.
---
Summary of 'EVENTS' that cause a 'REDRAW' of the plot:
Pressing Enter/Return key when focus is in the 'function-entry-field'. Alternatively, a button3-release in the 'function-entry-field'.
Pressing Enter/Return key when focus is in the
  - 'xmin' entry field
  - 'xmax' entry field
  - 'x-segs' entry field
  - 'ymin' entry field
  - 'ymax' entry field
  - 'y-segs' entry field
Alternatively, a button3-release in any of the 'grid-entry-fields'.
Button1-release on the LONGITUDE or LATITUDE scale widget.
Button1-release on the ZOOM scale widget.
Button1-release on the FILL or OUTLINE or BOTH radiobuttons.
Changing color via the FILL or OUTLINE color buttons.
ALSO: Resizing the window changes the size of the canvas, which triggers a redraw of the plot according to the new canvas size.
The code
I provide the code for this 3D-plot Tk-GUI script below.
I follow my usual 'canonical' structure for Tk code for this Tk script:
  0) Set general window & widget parms (win-name, win-position,
     win-color-scheme, fonts, widget-geometry-parms, win-size-control,
     text-array-for-labels-etc).

  1a) Define ALL frames (and sub-frames, if any).
  1b) Pack   ALL frames and sub-frames.

  2) Define & pack all widgets in the frames, frame by frame.
     Within each frame, define ALL the widgets. Then pack the widgets.

  3) Define keyboard and mouse/touchpad/touch-sensitive-screen action
     BINDINGS, if needed.

  4) Define PROCS, if needed.

  5) Additional GUI initialization (typically with one or more of
     the procs), if needed.
This structure is discussed in more detail on the page A Canonical Structure for Tk Code --- and variations.
This structure makes it easy for me to find code sections --- while generating and testing a Tk script, and when looking for code snippets to include in other scripts (code re-use).
I call your attention to step-zero. One new thing that I have started doing recently is using a text-array for text in labels, buttons, and other widgets in the GUI. This can make it easier for people to internationalize my scripts. I will be using a text-array like this in most of my scripts in the future.
Experimenting with the GUI
As in all my scripts that use the 'pack' geometry manager (which is all of my 100-plus scripts, so far), I provide the four main pack parameters --- '-side', '-anchor', '-fill', '-expand' --- on all of the 'pack' commands for the frames and widgets.
That helps me when I am initially testing the behavior of a GUI (the various widgets within it) as I resize the main window.
I think that I have used a nice choice of the 'pack' parameters. The labels and buttons and scales stay fixed in size and relative-location as the window is re-sized --- while the 'canvas' expands/contracts as the window is re-sized.
You can experiment with the '-side', '-anchor', '-fill', and '-expand' parameters on the 'pack' commands for the various frames and widgets --- to get the widget behavior that you want.
___
In addition, you might want to change the fonts used for the various GUI widgets. For example, you could change '-weight' from 'bold' to 'normal' --- or '-slant' from 'roman' to 'italic'. Or change font families.
In fact, you may NEED to change the font families, because the families I used may not be available on your computer --- and the default font that the 'wish' interpreter chooses may not be very pleasing.
I use variables to set geometry parameters of widgets --- parameters such as border-widths and padding. And I have included the '-relief' parameter on the definitions of frames and widgets. Feel free to experiment with those 'appearance' parameters as well.
___
Note that the color buttons call on a color-selector-GUI script to set the colors. You can make that color-selector script by cutting-and-pasting the code from the page A non-obfuscated color selector GUI on this site.
Some features in the code
That said, here's the code --- with plenty of comments to describe what most of the code-sections are doing.
You can look at the top of the PROCS section of the code to see a list of the procs used in this script, along with brief descriptions of how they are called and what they do.
___
One interesting feature of this GUI is the way the procs involved in a redraw are broken up into a sequence of four procs:
  1) load_points_array
  2) translate_points_array
  3) rotate_points
  4) draw_2D_pixel_polys
Some 'events' --- such as changing the function or the grid --- trigger the execution of all 4 procs (in that order), while other events (like longitude or latitude change) trigger the execution of only the last 2 procs. And some 'simple' changes (like a color change or a switch to wireframe mode) trigger the execution of only the last proc.
Note that I do most of the calculations in 'world coordinates', NOT pixel coordinates. All the calculations in the first 3 of the 4 procs are done in world coordinates.
It is in the 4th proc that I obtain a set of 2D points from a family of 3D points, and I map a 'bounding area' of the 2D points into the current canvas area, in units of pixels --- to finally get the plot, via 'create polygon' commands.
---
Like AM, I use the "painter's algorithm" (or my interpretation of it) to handle hiding portions of polygons that are hidden by polygons in the foreground. Hence I start drawing polygons from the corner of the grid that is farthest away from our view point (eye).
In other words, I let the xy quadrant --- over which the 'eye' lies --- (i.e. the quadrant of the longitudinal angle) determine the 'start corner' of the 'painting'.
For example, if the 'eye' is over the first quadrant of the xy plane, the 'start corner' of 'painting' will be the xmin,ymin (far) corner of the 'rectangular grid' below our x,y,f(x,y) points.
2nd example: If the 'eye' lies over the 3rd quadrant of the xy plane, the 'start corner' of 'painting' will be the xmax,ymax corner of the 'rectangular grid'.
Similarly, if over the 2nd quadrant, we start at xmax,ymin.
And, if over the 4th quadrant, we start at xmin,ymax.
If the 'eye' lies over the origin (or the x or y axis), then there are multiple choices for a 'start corner'.
___
It is my hope that the copious comments in the code will help Tcl-Tk coding 'newbies' get started in making GUI's like this.
Without the comments, potential young Tcler's might be tempted to return to their iPhones and iPads and iPods --- to watch videos of 101 ways to hurt yourself on a trampoline.
Code for the Tk script 'plot_funcsOf2vars_3DprojectOn2Dcanvas_RyRz.tk' :
#!/usr/bin/wish -f
##+###########################################################################
##
## SCRIPT: plot_funcsOf2vars_3DprojectOn2Dcanvas_RyRz.tk
##
## PURPOSE: This Tk script serves to plot functions of 2 variables, f(x,y), as
## projections of '3D grid points' onto a 2D 'viewing plane'.
##
## The '3D grid points' are given by x,y,f(x,y) where the x,y are
## points in a rectangular grid pattern.
##
## The 2D projection points, after being determined according to a
## user-specified view direction, specified via longitude & latitude
## angles, are 'mapped' onto a rectangular Tk canvas.
##
## The '3D plot' is achieved by plotting 4-sided polygons made from
## the 2D projection points of the corners of the quadrilateral
## (not necessarily planar) polygons in 3-space.
##
## The script provides a GUI on which there is an entry field
## into which the user can enter mathematical expressions in
## variables specified as '$x' and '$y'. Examples:
##
## (20. - ($x*$x + $y*$y)) * (20. - ($x*$x + $y*$y))
##
## $x * (10. - $x) * (100. - ($y*$y))
##
## cos(6.0 * $x) * cos(6.0 * $y)
##
## These expressions provide f(x,y).
##
##+#########
## INSPIRED BY:
## This script is inspired by a script titled 'view3d.tcl'
## from AM (Arjen Markus), 2003 May --- presented on the page
## 'Viewer for functions of 2 variables' at https://wiki.tcl-lang.org/8928.
##
## That script indicated that it should be possible to use
## Tcl-Tk to do plots of 3D functions involving hundreds or thousands
## of data points, projected onto a Tk canvas as polygons,
## within a second for each complete plot.
##
## Arjen Markus (AM) wrote:
##
## "This is just another one of those little applications that may
## come in handy sometimes. Though it is not as flexible as it probably
## should be --- no facilities for entering the expression in a GUI,
## no adjustment of the scaling nor of the viewpoint --- still it can be
## a useful tool or the starting point of one."
##
## That is what I intend to do, with this Tk GUI script --- add facilities
## to make it a more useful tool --- 9 years after he wrote that
## statement/challenge. At the same time, I hope to get a start on learning
## 3D computer graphics techniques as implemented in 'vanilla' Tcl-Tk.
##
## AM provided no widgets by which to control the display or enter the function.
## He animated the plot view with an oscillating view vector. He used a
## 10 millisec pause at the end of each plot, before starting the calculations
## and 'create polygon' commands for the next plot.
##
## On the same wiki page https://wiki.tcl-lang.org/8928 - 'Viewer for functions of
## 2 variables', MM (Marco Maggi) added an alternative script.
##
## MM (Marco Maggi) provided about a dozen GUI widgets to make a Tk script that
## is quite a bit more useful, without the user having to edit the Tk script.
## Some of the widgets he added:
##
## MM provided a 'Draw' button to do the redraw after any changes via the widgets.
##
## MM added a function entry field and some control capabilities (mostly via
## spinboxes) --- such as adjustment of viewpoint (via longitude and latitude
## angles), xy domain setting (min,max), xy grid setting ('steps'), and
## some xyz scaling.
##
## However, keeping the function projection within the canvas without distorting
## the plot quite a bit seems to be problematic with the MM script. It seems the
## way to do that (and not distort the plot) is to change the x, y, and z scales
## equally, via 3 spinboxes and then click the 'Draw' button. This is rather tedious
## and slow. In fact, by providing the 'Draw' button as the only way to redraw the
## plot after a change (esp. a viewpoint change), it is impossible to rotate the
## plot quickly and smoothly --- and thus investigate quickly whether the code is
## showing the surface correctly (esp. the hidden polygons) no matter the 'view point'.
##
## Furthermore, color control in the AM and MM scripts was rather sparse.
##
## AM's function display was a wireframe --- black lines on a white background.
## Although MM added some gray-shading of the polygons, there was no control of
## canvas background color and very little control of the color of the polygons
## (3 color options - gray, white, green - with shading provided in the gray case,
## based on z-height, NOT light source and angle of polygons to the light source).
##
## MM did not provide an option to turn off the wireframe (polygon outlines).
##
##+#########################
## Here are some features of my script versus the MM script:
##
## MM allowed the user to specify latitude and longitude angles to specify
## the view direction. I do the same.
##
## However, instead of spin-boxes, I use Tk scales so that setting the 2 view angles
## can be done more quickly and redraw is more immediate. And I use button1-release
## bindings on the scales to cause the redraw as soon as a scale change is complete.
##
## (I may eventually add bindings to mouse events on the canvas, like <Motion>,
## so that the view rotation can be done even more quickly & conveniently.
## This would be similar to rotate/zoom/pan controls that Mark Stuckey provided
## in a 3D model viewer that he published at wiki.tcl.tk/15032.)
##
## In addition to having an entry field for the function f(x,y),
## I added a listbox of sample functions on the left of the GUI. Clicking on
## a line in the listbox puts a function in the entry field. This provides a way
## of providing some interesting functions that a user can quickly try (and alter),
## instead of the user spending time trying to think of functions to try.
## By using the listbox, an essentially unlimited number of interesting functions
## could be supplied eventually.
##
## I allow color choices for the
## - canvas background
## - the polygon fill
## - the polygon outline
## from among 16 million colors, each.
##
## I provide 3 radiobuttons by which polygon fill, outline (wireframe display on the
## canvas background color), or both (fill and outline) can be specified.
##
## I provide a 'zoom' Tk scale widget, by which the plot can easily be resized,
## down or up --- to make sure the entire plot can be seen on the canvas. Like
## with the 2 scales for the longitude-latitude view angles, I use a button1-release
## binding on the zoom scale to cause the redraw as soon as a scale change is
## complete.
##
## This GUI is an enhancement of the AM script --- many more GUI widget options
## than his zero options. This GUI is also an enhancement of the MM script
## with some more options, such as more color control, more ways of triggering
## a redraw, more immediate redraws, and easier-quicker control on putting the
## entire plot within the canvas.
##
##+###################
## MATH CONSIDERATIONS:
##
## This script takes a somewhat different mathematical approach than either
## the AM or MM script. Some notes on this follow.
##
## NOTE0: It is not clear where the projection formulas of AM and MM came from
## --- nor whether they formulas would work for a wide variety of functions and
## projection vectors ('viewpoints').
##
## Even MM said: "I was not able to do reverse engineering on the code in
## 'setViewpoint'. AM, what are you doing here?"
##
## After a significant amount of web searching and book searching, I could not
## find similar formulas to ones used by AM & MM --- for example, for rotation
## and 2D projection.
##
## In fact, after much web searching and book searching, I couldn't
## find ANY decent presentation of formulas for projecting 3D points
## in xyz-space onto a viewing plane determined from a given view direction
## (given by longitude and latitude angles) --- especially a presentation that
## applied fairly directly to this application --- plotting of a function f(x,y)
## or a surface of that type.
##
## There are, of course, general presentations of rotation matrices in various
## books on 3D CG (computer graphics), but I could not find a presentation
## that applied a general presentation to a more specific case like rotating
## a 3D-projection-plot of a function of 2 variables. Most presentations gave
## an extremely cursory treatment of 2D projection, if any presentation at all.
##
## Rather than trying to use the AM or MM formulas and approach (that were hard
## for me to 'crack'), I decided to derive an approach and set of formulas myself.
## If I could do so, then I would understand the formulas and their application
## methods and limits much better.
##
## I have derived a set of formulas based on a Ry.Rz rotation matrix approach
## where Rz is a (longitudinal) rotation about the z-axis and Ry is a
## (latitudinal) rotation about the rotated y-axis.
##
## I may publish a discussion on another wiki.tcl.tk page --- since such
## discussions seem so hard to find.
## The derivation/walk-thru is instructive --- to me anyway. The concepts
## and techniques will probably be useful for other 3D Tk-script projects ---
## such as viewing of terrain surfaces and examining 3D models (composed of
## triangular polygons).
##
## NOTE1:
## I do most of my derivation and calculations in 'world coordinates'.
## When I have a set of 2D points from a family of 3D points, I map
## a 'bounding area' of the 2D points into the current canvas area,
## in units of pixels --- to finally get the plot.
##
## NOTE2:
## Like AM, I use the "painter's algorithm" (or my interpretation of it)
## to handle hiding portions of polygons that are hidden by
## polygons in the foreground. Hence I start drawing polygons from
## the corner of the grid that is farthest away from our view point (eye).
##
## In other words, I let the xy quadrant --- over which the 'eye' lies ---
## (i.e. the quadrant of the longitudinal angle) determine the 'start corner'
## of the 'painting'.
##
## For example, if the 'eye' is over the first quadrant of the xy plane,
## the 'start corner' of 'painting' will be the xmin,ymin (far) corner of the
## 'rectangular grid' below our x,y,f(x,y) points.
##
## 2nd example: If the 'eye' lies over the 3rd quadrant of the xy plane,
## the 'start corner' of 'painting' will be the xmax,ymax corner
## of the 'rectangular grid'.
##
## Similarly, if over the 2nd quadrant, we start at xmax,ymin.
##
## And, if over the 4th quadrant, we start at xmin,ymax.
##
## If the 'eye' lies over the origin (or the x or y axis), then there are
## multiple choices for a 'start corner'.
##
##--------------------------------------------------------------------------
## A Q&A on the hidden lines method --- from the wiki-8928 page:
##
## "Marco Maggi: Interesting. Will this always work? I mean:
## hidden lines will be hidden correctly for all the functions?
##
## AM: It relies on the so-called "painter's algorithm" - draw the objects
## in the back first and work your way forwards. This is somewhat hidden
## in the proc 'drawFunction' (hence the use of the vectors for calculating
## the corners of the rectangles) and the range of the viewpoint coordinates.
##
## Part of the work to make it more general is to decide what the
## two vectors should be ... But apart from that: yes, the algorithm
## is robust (and cheap)."
##
##+#########################################################################
## GUI FEATURES:
## This script provides a Tk GUI that includes the following widgets
## and features.
##
## 1) There is a FUNCTION-ENTRY FIELD on this GUI.
##
## 2) There is a LISTBOX (on the left of the GUI) which provides a
## list of functions that can be selected --- and put in
## the FUNCTION-ENTRY FIELD with a simple mouse click.
##
## 3) The user presses the Return/Enter key on the function-entry field
## --- or uses a button3-release on the field --- to cause the
## selected/entered function to be (re)plotted on the canvas.
##
## 4) There are 2 scales for setting longitude-latitude angles that
## determine the view direction --- and therby specify the direction
## of the projection (of 3D points onto a 2D 'viewing plane').
##
## 5) There are entry fields for the x-range and y-range of
## the rectangular grid to be used for the plot. And the
## user can also specify integers Nxseg and Nyseg --- to specify
## how many segments will be used for the x and y sides of the
## rectangular 'independent variable domain'.
##
## 6) There are also some color buttons on the GUI that allow
## the user to specify
## - a 'fill'-color for the 4-sided polygons that make up the
## 3D surface being plotted
## - an 'outline'-color for the 4-sided polygons
## - a color for the background of the plot (the canvas).
##
##+#######################################################################
## 'CANONICAL' STRUCTURE OF THIS CODE:
##
## 0) Set general window parms (win-name, win-position, color-scheme,
## fonts,widget-geometry-parameters, win-size-control).
## 1) Define ALL frames (and sub-frames). Pack them.
## 2) Define & pack all widgets in the frames, frame-by-frame.
##
## 3) Define key and mouse/touchpad/touch-sensitive-screen 'event'
## BINDINGS, if needed.
## 4) Define PROCS, if needed.
## 5) Additional GUI initialization (typically with one or more of
## the procs), if needed.
##
##+#################################
## Some detail of the code structure of this particular script:
##
## 1a) Define ALL frames:
##
## Top-level :
## 'fRleft' - to contain a listbox and its scrollbars, and a zoom scale
## 'fRright' - to contain a canvas widget, with various widgets above it
##
## Sub-frames of 'fRleft' (top to bottom):
## - 'fRlistbox' - to contain one listbox widget with xy scrollbars
## - 'fRzoom' - to contain a scale widget
##
## Sub-frames of 'fRright' (top to bottom):
##
## 'fRbuttons' - to contain an 'Exit' button,
## (a 'Help' button, someday?),
## 3 color-setting buttons, and
## a label widget to show current color parm values
## 'fRgridspecs' - entry widgets for x-range,y-range,Nxsegs,Nysegs
## 'fRviewparms' - entry widgets to specify a view direction -- via a
## longitude angle and a latitude angle
## 'fRfunction' - to contain label & entry widgets for f(x,y)
## 'fRcan' - to contain the canvas widget.
##
## 1b) Pack ALL frames.
##
## 2) Define & pack all widgets in the frames -- basically going through
## frames & their interiors in left-to-right and/or top-to-bottom order:
##
## 3) Define bindings:
## - Button1-release on the listbox (to fill the function entry field)
## - DoubleButton1-release on the function-entry field
## - Return key press on the function-entry widget
## Also
## - Return/Button1-release on the x-range,y-range,Nxsegs,Nysegs
## entry widgets
## - Return/Button1-release on the xyz viewpoint/projection-vector
## entry widgets
##
## 4) Define procs:
## - 4 procs to do load-data, translate-data, rotate-data, and
## then pixel-draw-the-polygons.
## - 3 procs for setting colors (fill, outline, background/canvas)
## - and some other procs (See the PROCS section in the code below.)
##
## The 4 load-translate-rotate-draw procs were devised to replace AM's procs,
## names below --- whose mathematics would take too much work to make
## comprehensible.
## - setViewpoint
## - drawFunction
## - project2d
## It would have been nice if AM (and MM) had provided more comments on the
## purpose and/or basis of various equations and statements --- or
## at least provided some references, to indicate the basis and purpose
## of his/their formulas.
##
## 5) Additional GUI initialization:
## - use the 4 load-translate-rotate-draw procs to draw a plot on the canvas
## for an initial function, initial grid-creation-parameters, and
## an initial view direction (longitude,latitude) ---
## to start the GUI with a non-empty canvas.
##
## ****
## NOTE: If a new function is to be added to the functions listbox:
## ****
## The user can edit this script and add to the 'insert end' statements
## near the 'listbox' statement that defines the listbox widget.
## Those 'insert end' statements are in 'code section 2',
## briefly described above.
##
##+#######################################################################
## DEVELOPED WITH: Tcl-Tk 8.5 on Ubuntu 9.10 (2009-october, 'Karmic Koala')
##
## $ wish
## % puts "$tcl_version $tk_version"
##
## showed
## 8.5 8.5
## but this script should work in most previous 8.x versions, and probably
## even in some 7.x versions (if font handling is made 'old-style').
##+#######################################################################
## MAINTENANCE HISTORY:
## Started by: Blaise Montandon 2012sep11 Got the GUI up.
## Changed by: Blaise Montandon 2012sep15 Tried a basic-geometry approach
## (lots of use of Pythagorean theorem).
## Changed by: Blaise Montandon 2012dec11 Changed to a spherical-coordinates
## approach.
## Changed by: Blaise Montandon 2012dec14 Changed to use of RyRz rotation
## matrix product approach.
## Changed by: Blaise Montandon 2012dec17 Added millisecs redraw-time-capture
## to 3 'wrapper' procs --- by adding
## proc 'wrap_draw_2D_pixel_polys' and
## proc 'update_status_label'. Also
## made some changes to the 'rotate'
## proc and some scale widget parms.
## Changed by: Blaise Montandon 2012dec18 Added code to the 'draw_2D_pixel_polys'
## proc to provide gradation of the
## fill color of polygons according to
## their z-height, in the case that
## fill-only (no outlines) is chosen.
## Changed by: Blaise Montandon 2012dec28 Added more functions including the
## 'sombrero function'.
##+########################################################################
##+#######################################################################
## Set general window parms (title,position).
##+#######################################################################
wm title . "'3D plot' of Functions of 2 Variables"
wm iconname . "PlotF(x,y)"
wm geometry . +15+30
##+######################################################
## Set the color scheme for the window and its widgets ---
## such as entry field and listbox background color.
##+######################################################
tk_setPalette "#e0e0e0"
## Initialize the polygons color
## and the background color for the canvas.
# set COLOR1r 255
# set COLOR1g 255
# set COLOR1b 255
set COLOR1r 255
set COLOR1g 0
set COLOR1b 255
set COLOR1hex [format "#%02X%02X%02X" $COLOR1r $COLOR1g $COLOR1b]
# set COLOR2r 255
# set COLOR2g 255
# set COLOR2b 255
set COLOR2r 255
set COLOR2g 255
set COLOR2b 255
set COLOR2hex [format "#%02X%02X%02X" $COLOR2r $COLOR2g $COLOR2b]
# set COLORbkGNDr 60
# set COLORbkGNDg 60
# set COLORbkGNDb 60
set COLORbkGNDr 0
set COLORbkGNDg 0
set COLORbkGNDb 0
set COLORbkGNDhex \
[format "#%02X%02X%02X" $COLORbkGNDr $COLORbkGNDg $COLORbkGNDb]
set listboxBKGD "#f0f0f0"
set entryBKGD "#f0f0f0"
set scaleBKGD "#f0f0f0"
set radbuttBKGD "#f0f0f0"
##+########################################################
## Use a VARIABLE-WIDTH font for text on label and
## button widgets.
##
## Use a FIXED-WIDTH font for the listbox list and for
## the text in the entry field.
##+########################################################
font create fontTEMP_varwidth \
-family {comic sans ms} \
-size -14 \
-weight bold \
-slant roman
font create fontTEMP_SMALL_varwidth \
-family {comic sans ms} \
-size -10 \
-weight bold \
-slant roman
## Some other possible (similar) variable width fonts:
## Arial
## Bitstream Vera Sans
## DejaVu Sans
## Droid Sans
## FreeSans
## Liberation Sans
## Nimbus Sans L
## Trebuchet MS
## Verdana
font create fontTEMP_fixedwidth \
-family {liberation mono} \
-size -14 \
-weight bold \
-slant roman
font create fontTEMP_SMALL_fixedwidth \
-family {liberation mono} \
-size -10 \
-weight bold \
-slant roman
## Some other possible fixed width fonts (esp. on Linux):
## Andale Mono
## Bitstream Vera Sans Mono
## Courier 10 Pitch
## DejaVu Sans Mono
## Droid Sans Mono
## FreeMono
## Nimbus Mono L
## TlwgMono
##+###########################################################
## SET GEOM VARS FOR THE VARIOUS WIDGET DEFINITIONS.
## (e.g. width and height of canvas, and padding for Buttons)
##+###########################################################
## CANVAS widget geom settings:
set initCanWidthPx 300
set initCanHeightPx 300
set minCanWidthPx 100
set minCanHeightPx 24
# set BDwidthPx_canvas 2
set BDwidthPx_canvas 0
## BUTTON widget geom settings:
set PADXpx_button 0
set PADYpx_button 0
set BDwidthPx_button 2
## ENTRY widget geom settings:
set BDwidthPx_entry 2
set initFuncEntryWidthChars 20
set xyrangevarEntryWidthChars 5
## LISTBOX geom settings:
set BDwidthPx_listbox 2
set initListboxWidthChars 30
set initListboxHeightChars 8
## SCALE geom parameters:
set BDwidthPx_scale 2
set initScaleLengthPx 200
## RADIOBUTTON geom parameters:
set PADXpx_radbutt 0
set PADYpx_radbutt 0
set BDwidthPx_radbutt 2
## CHECKBUTTON geom parameters:
set PADXpx_chkbutt 0
set PADYpx_chkbutt 0
set BDwidthPx_chkbutt 2
##+######################################################
## Set a minsize of the window (roughly) according to the
## approx min width of the listbox and function-entry
## widgets (about 20 chars each)
## --- and according to the approx min height of the
## listbox widget, about 8 lines.
##+######################################################
set charWidthPx [font measure fontTEMP_fixedwidth "0"]
## Use the init width of the listbox and entry widgets, in chars,
## to calculate their total width in pixels. Then add some
## pixels to account for right-left-size of window-manager decoration,
## frame/widget borders, and the vertical listbox scrollbar.
set minWinWidthPx [expr 20 + ( $initListboxWidthChars * $charWidthPx ) + \
( $initFuncEntryWidthChars * $charWidthPx )]
set charHeightPx [font metrics fontTEMP_fixedwidth -linespace]
## Get the height of the init number of lines in the listbox
## and add about 20 pixels for top-bottom window decoration --
## and about 8 pixels for frame/widget borders.
set minWinHeightPx [expr 28 + ( $initListboxHeightChars * $charHeightPx ) ]
## FOR TESTING:
# puts "minWinWidthPx = $minWinWidthPx"
# puts "minWinHeightPx = $minWinHeightPx"
wm minsize . $minWinWidthPx $minWinHeightPx
## We allow the window to be resizable and we pack the canvas with
## '-fill both' so that the canvas can be enlarged by enlarging the
## window.
##
## Just double-click on the entry field (or press the
## Enter key) to re-fill the canvas according to the
## the user-specified composite-function.
## If you want to make the window un-resizable,
## you can use the following statement.
# wm resizable . 0 0
##+####################################################################
## Set a TEXT-ARRAY to hold text for buttons & labels on the GUI.
## NOTE: This can aid INTERNATIONALIZATION. This array can
## be set according to a nation/region parameter.
##+####################################################################
## if { "$VARlocale" == "en"}
set aRtext(labelZOOM) "Zoom:"
set aRtext(buttonEXIT) "Exit"
set aRtext(buttonHELP) "Help"
set aRtext(buttonCOLOR1) "Polygon
Fill Color"
set aRtext(buttonCOLOR2) "Polygon
Outline Color"
set aRtext(buttonBkgdCOLOR) "Background
Color"
set aRtext(radbuttFILL) "Fill polys"
set aRtext(radbuttOUTLINE) "Outline polys"
set aRtext(radbuttBOTH) "Both"
set aRtext(labelGRID) "Grid:"
set aRtext(labelXMIN) " xmin"
set aRtext(labelXMAX) " xmax"
set aRtext(labelXSEGS) " x-segs"
set aRtext(labelYMIN) " ymin"
set aRtext(labelYMAX) " ymax"
set aRtext(labelYSEGS) " y-segs"
set aRtext(labelVIEW) "View via 2 angles
longitude,latitude:"
# set aRtext(scaleLON) "longitude"
# set aRtext(scaleLAT) "latitude"
set aRtext(labelFUNCTION) "Function of 2 vars (\$x & \$y):"
## END OF if { "$VARlocale" == "en"}
##+################################################################
## DEFINE *ALL* THE FRAMES:
##
## Top-level : '.fRleft' , '.fRright'
##
## Sub-frames: '.fRleft.fRlistbox' and '.fRleft.fRzoom'
##
## '.fRright.fRbuttons' and '.fRright.fRgridspecs' and
## '.fRright.fRviewparms' and
## '.fRright.fRfunction' and '.fRright.fRcan'
##
##+################################################################
## FOR TESTING: (esp. to check behavior during window expansion)
# set BDwidth_frame 2
# set RELIEF_frame raised
set BDwidth_frame 0
set RELIEF_frame flat
frame .fRleft -relief $RELIEF_frame -borderwidth $BDwidth_frame
frame .fRright -relief $RELIEF_frame -borderwidth $BDwidth_frame
frame .fRleft.fRlistbox -relief $RELIEF_frame -borderwidth $BDwidth_frame
frame .fRleft.fRzoom -relief $RELIEF_frame -borderwidth $BDwidth_frame
frame .fRright.fRbuttons -relief $RELIEF_frame -bd $BDwidth_frame
frame .fRright.fRgridspecs -relief $RELIEF_frame -bd $BDwidth_frame
frame .fRright.fRviewparms -relief $RELIEF_frame -bd $BDwidth_frame
frame .fRright.fRfunction -relief $RELIEF_frame -bd $BDwidth_frame
frame .fRright.fRcan -relief $RELIEF_frame -bd $BDwidth_frame
##+##############################
## PACK the FRAMES.
##+##############################
pack .fRleft \
-side left \
-anchor nw \
-fill both \
-expand 1
pack .fRright \
-side left \
-anchor nw \
-fill both \
-expand 1
## Pack the sub-frames.
pack .fRleft.fRlistbox \
-side top \
-anchor nw \
-fill both \
-expand 1
pack .fRleft.fRzoom \
-side top \
-anchor nw \
-fill x \
-expand 0
pack .fRright.fRbuttons \
.fRright.fRgridspecs \
.fRright.fRviewparms \
.fRright.fRfunction \
-side top \
-anchor nw \
-fill x \
-expand 0
pack .fRright.fRcan \
-side top \
-anchor nw \
-fill both \
-expand 1
##+######################################################
## In FRAME '.fRleft.fRlistbox' -
## DEFINE-and-PACK a LISTBOX WIDGET,
## with scrollbars --- for a list of functions of 2 vars.
##+######################################################
listbox .fRleft.fRlistbox.listbox \
-width $initListboxWidthChars \
-height $initListboxHeightChars \
-font fontTEMP_fixedwidth \
-relief raised \
-borderwidth $BDwidthPx_listbox \
-state normal \
-yscrollcommand ".fRleft.fRlistbox.scrbary set" \
-xscrollcommand ".fRleft.fRlistbox.scrbarx set"
scrollbar .fRleft.fRlistbox.scrbary \
-orient vertical \
-command ".fRleft.fRlistbox.listbox yview"
scrollbar .fRleft.fRlistbox.scrbarx \
-orient horizontal \
-command ".fRleft.fRlistbox.listbox xview"
##+##########################################################
## Insert each sample f(xy) function into the listbox list.
##+##########################################################
## NOTE: We can change the order of funcs in the list by
## moving these 'insert' statements around.
##+##########################################################
## Make sure the listbox is empty.
.fRleft.fRlistbox.listbox delete 0 end
.fRleft.fRlistbox.listbox insert end {(2.0-($x*$x+$y*$y))*(2.0-($x*$x+$y*$y))}
.fRleft.fRlistbox.listbox insert end {10.0 - (1.0*$x*$x) - (3.0*$y*$y)}
.fRleft.fRlistbox.listbox insert end {cos($pi*$x)*cos($pi*$y)}
.fRleft.fRlistbox.listbox insert end {sin($pi*$x)*cos($pi*$y)}
.fRleft.fRlistbox.listbox insert end {cos(1.5*$pi*$x)*cos(1.5*$pi*$y)}
.fRleft.fRlistbox.listbox insert end {($x*$x+$y*$y) * cos($pi*$x)*cos($pi*$y)}
.fRleft.fRlistbox.listbox insert end {cos($twopi*$x)*cos($twopi*$y)}
.fRleft.fRlistbox.listbox insert end {cos($twopi * $x) * sin($twopi * $y)}
.fRleft.fRlistbox.listbox insert end {$x * $y * cos( 2.0 * ($x * $x) + 2.0 * ($y * $y) )}
.fRleft.fRlistbox.listbox insert end {(2.0*($x*$x)) + (2.0*($y*$y))}
.fRleft.fRlistbox.listbox insert end {-sqrt(2.0*($x*$x) + 2.0*($y*$y))}
.fRleft.fRlistbox.listbox insert end {-pow(($x*$x) + ($y*$y),0.35)}
.fRleft.fRlistbox.listbox insert end {(-1.0 * $x) * (1.0 * $y)}
.fRleft.fRlistbox.listbox insert end {(1.0*$x*$x) - (1.0*$y*$y)}
.fRleft.fRlistbox.listbox insert end {(0.5*$x*$x*$x) - (0.5*$y*$y*$y)}
.fRleft.fRlistbox.listbox insert end {0.5*cos(8.0*sqrt($x*$x+$y*$y))*cos(8.0*sqrt($x*$x+$y*$y)) * exp(-1.5*sqrt($x*$x+$y*$y))}
.fRleft.fRlistbox.listbox insert end {0.5*cos(8.0*sqrt($x*$x+$y*$y))}
.fRleft.fRlistbox.listbox insert end {sin($twopi*sqrt(($x*$x) + ($y*$y)))}
.fRleft.fRlistbox.listbox insert end {sin(sqrt(30*$twopi*($x*$x + $y*$y + 0.001))) / sqrt(30*$twopi*($x*$x + $y*$y + 0.001))}
.fRleft.fRlistbox.listbox insert end {-2.0*($x + $y) * exp(-6.*($x*$x+$y*$y))}
.fRleft.fRlistbox.listbox insert end {1.0*sin($pi*($x + $y))*sin($pi*($x + $y)) * exp(-3.*($x*$x+$y*$y))}
.fRleft.fRlistbox.listbox insert end {6.0*($x*$x+$y*$y) * exp(-2.0*($x*$x+$y*$y))}
.fRleft.fRlistbox.listbox insert end {(6.0*($x*$x-$y*$y)) * exp(-6.*($x*$x+$y*$y))}
.fRleft.fRlistbox.listbox insert end {(2.0 - (0.1*$x*$x + 19.0*$y*$y*$y)) * exp(-2.5*($x*$x + $y*$y))}
.fRleft.fRlistbox.listbox insert end {0.5*$x*$y*$y*exp(0.5*($x + $y))}
.fRleft.fRlistbox.listbox insert end {4.0 / (1.0 + $x*$x*$x*$x + $y*$y*$y*$y)}
.fRleft.fRlistbox.listbox insert end {-pow($x,4.0) - pow($y,4.0) + 1.75*$x*$y}
.fRleft.fRlistbox.listbox insert end {0.5*$y*$y + 1 - cos($pi*$x)}
.fRleft.fRlistbox.listbox insert end {0.5*exp(-1.0*$x) * sin($pi*$y)}
.fRleft.fRlistbox.listbox insert end {1.5*$x*$x*$x * sin(1.5*$twopi*$y)}
.fRleft.fRlistbox.listbox insert end {1.0*cos(2.0*$twopi*$x*$y) / (1.0 + 9.0*$y*$y)}
.fRleft.fRlistbox.listbox insert end {1.0*cos($twopi*($x+$y)) / (1.0 + 8.0*($x-$y)*($x-$y))}
.fRleft.fRlistbox.listbox insert end {1.0*sin(1.0*$twopi*$y*$y) + (2.5 / (1.0 + 6.0*$x*$x + 6.0*$y*$y))}
.fRleft.fRlistbox.listbox insert end {1.0*cos($pi*$x)*cos($pi*($x+$y))}
.fRleft.fRlistbox.listbox insert end {1.0*$y*cos($pi*$x)*cos($pi*($x*$x+$y*$y))}
.fRleft.fRlistbox.listbox insert end {sqrt(abs($x)*abs($y))}
.fRleft.fRlistbox.listbox insert end {pow(abs($x)*abs($y),0.25)}
.fRleft.fRlistbox.listbox insert end {0.45*max($x,$y)}
.fRleft.fRlistbox.listbox insert end {-ceil(5.5*max(0.5*$x,0.5*$y))}
.fRleft.fRlistbox.listbox insert end {-0.2*ceil(2.*$x)*ceil(2.*$y)}
.fRleft.fRlistbox.listbox insert end {0.1*floor(2.*$x)*floor(2.*$y)}
.fRleft.fRlistbox.listbox insert end {-0.2*ceil(max(2.*$x+.1,2.*$y+.1))}
.fRleft.fRlistbox.listbox insert end {-$x*$x*ceil($y)}
.fRleft.fRlistbox.listbox insert end {-0.2*$x*$x*ceil(3.0*$y)}
.fRleft.fRlistbox.listbox insert end {-ceil(0.5*$x)*ceil(0.5*$y)/(1+$x*$x+$y*$y)}
.fRleft.fRlistbox.listbox insert end {-0.5*ceil(2.5*$x*$x)*ceil(2.5*$y*$y)}
.fRleft.fRlistbox.listbox insert end {3.0*fmod($x,0.25)*fmod($y,0.25)}
.fRleft.fRlistbox.listbox insert end {0.1*entier(3.0*$x+0.1)*entier(3.0*$y+0.1)}
.fRleft.fRlistbox.listbox insert end {0.1*entier(5.0*$x*$x)*entier(5.0*$y*$y)}
.fRleft.fRlistbox.listbox insert end {0.5*isqrt(1.0*$x*$x + 1.0*$y*$y)}
.fRleft.fRlistbox.listbox insert end {-1.0*$x - 1.0*$y + 1.0}
.fRleft.fRlistbox.listbox insert end {0.0}
.fRleft.fRlistbox.listbox insert end {1000.0}
# .fRleft.fRlistbox.listbox insert end {$x*(0.5-$x) * (0.5-($y*$y))}
##+#####################################################################
## Get the number of functions loaded into the listbox.
##
## In a label widget defined in a right-frame, like .fRright.fRviewparms,
## we will show the number of funcs, in a label in the GUI ---
## for users to know how many are in the listbox, perhaps out of sight.
## Also put some GUI usage help info in the same label.
##+#####################################################################
set numfuncs [.fRleft.fRlistbox.listbox index end]
## Pack the listbox and its scrollbars.
pack .fRleft.fRlistbox.scrbary \
-side right \
-anchor e \
-fill y \
-expand 0
pack .fRleft.fRlistbox.scrbarx \
-side bottom \
-anchor s \
-fill x \
-expand 0
## We need to pack the listbox AFTER
## the scrollbars, to get the scrollbars
## positioned properly --- BEFORE
## the listbox FILLS the pack area.
pack .fRleft.fRlistbox.listbox \
-side top \
-anchor nw \
-fill both \
-expand 1
##+######################################################
## In FRAME '.fRleft.fRzoom' -
## DEFINE-and-PACK a LABEL & SCALE WIDGET.
##+######################################################
## Define a label widget to precede the zoom-scale.
label .fRleft.fRzoom.labelZOOM \
-text "$aRtext(labelZOOM)" \
-font fontTEMP_varwidth \
-justify left \
-anchor w \
-relief flat \
-bd $BDwidthPx_button
## We set the initial value for this 'scaleZOOM' widget in the
## GUI initialization section at the bottom of this script.
# set curZOOM 1.0
# set curZOOM 0.8
scale .fRleft.fRzoom.scaleZOOM \
-orient horizontal \
-resolution 0.1 \
-from 0.1 -to 10.0 \
-digits 3 \
-length 200 \
-repeatdelay 500 \
-repeatinterval 50 \
-font fontTEMP_varwidth \
-troughcolor "$scaleBKGD" \
-variable curZOOM
# -command "wrap_draw_2D_pixel_polys 0"
## PACK the widgets of FRAME .fRleft.fRzoom ---
## label and scale.
pack .fRleft.fRzoom.labelZOOM \
-side left \
-anchor w \
-fill none \
-expand 0
pack .fRleft.fRzoom.scaleZOOM \
-side left \
-anchor w \
-fill none \
-expand 0
## Using '-fill x -expand 1' with redraws on changing the zoom
## may cause the scale to 'go crazy' if you click in the trough.
## The sliderbar keeps advancing on its own and many redraws are done.
## This may happen in conjunction with the <Configure> binding
## on the canvas widget.
## For now, we use '-fill none -expand 0'.
##+#################################
## In FRAME '.fRright.fRgridspecs' -
## DEFINE-and-PACK 'BUTTON' WIDGETS
## --- exit and color buttons, and
## a label to show current color vals.
## Also checkbuttons for fill, outline.
##+#################################
button .fRright.fRbuttons.buttEXIT \
-text "$aRtext(buttonEXIT)" \
-font fontTEMP_varwidth \
-padx $PADXpx_button \
-pady $PADYpx_button \
-relief raised \
-bd $BDwidthPx_button \
-command {exit}
button .fRright.fRbuttons.buttHELP \
-text "$aRtext(buttonHELP)" \
-font fontTEMP_varwidth \
-padx $PADXpx_button \
-pady $PADYpx_button \
-relief raised \
-bd $BDwidthPx_button \
-command {popup_msg_var_scroll "$HELPtext"}
button .fRright.fRbuttons.buttCOLOR1 \
-text "$aRtext(buttonCOLOR1)" \
-font fontTEMP_SMALL_varwidth \
-padx $PADXpx_button \
-pady $PADYpx_button \
-relief raised \
-bd $BDwidthPx_button \
-command "set_polygon_color1"
button .fRright.fRbuttons.buttCOLOR2 \
-text "$aRtext(buttonCOLOR2)" \
-font fontTEMP_SMALL_varwidth \
-padx $PADXpx_button \
-pady $PADYpx_button \
-relief raised \
-bd $BDwidthPx_button \
-command "set_polygon_color2"
button .fRright.fRbuttons.buttCOLORbkGND \
-text "$aRtext(buttonBkgdCOLOR)" \
-font fontTEMP_SMALL_varwidth \
-padx $PADXpx_button \
-pady $PADYpx_button \
-relief raised \
-bd $BDwidthPx_button \
-command "set_background_color"
label .fRright.fRbuttons.labelCOLORS \
-text "" \
-font fontTEMP_SMALL_varwidth \
-justify left \
-anchor w \
-relief flat \
-bd $BDwidthPx_button
## We set the initial value for these radiobutton widgets in the
## GUI initialization section at the bottom of this script.
# set poly_filloutboth "both"
radiobutton .fRright.fRbuttons.radbuttFILL \
-text "$aRtext(radbuttFILL)" \
-font fontTEMP_varwidth \
-anchor w \
-variable poly_filloutboth \
-value "fill" \
-selectcolor "$radbuttBKGD" \
-relief flat \
-padx $PADXpx_radbutt \
-pady $PADYpx_radbutt \
-bd $BDwidthPx_radbutt
radiobutton .fRright.fRbuttons.radbuttOUTLINE \
-text "$aRtext(radbuttOUTLINE)" \
-font fontTEMP_varwidth \
-anchor w \
-variable poly_filloutboth \
-value "outline" \
-selectcolor "$radbuttBKGD" \
-relief flat \
-padx $PADXpx_radbutt \
-pady $PADYpx_radbutt \
-bd $BDwidthPx_radbutt
radiobutton .fRright.fRbuttons.radbuttBOTH \
-text "$aRtext(radbuttBOTH)" \
-font fontTEMP_varwidth \
-anchor w \
-variable poly_filloutboth \
-value "both" \
-selectcolor "$radbuttBKGD" \
-relief flat \
-padx $PADXpx_radbutt \
-pady $PADYpx_radbutt \
-bd $BDwidthPx_radbutt
## Pack the 'frbuttons' widgets.
pack .fRright.fRbuttons.buttEXIT \
.fRright.fRbuttons.buttHELP \
.fRright.fRbuttons.buttCOLOR1 \
.fRright.fRbuttons.buttCOLOR2 \
.fRright.fRbuttons.buttCOLORbkGND \
.fRright.fRbuttons.labelCOLORS \
-side left \
-anchor w \
-fill none \
-expand 0
pack .fRright.fRbuttons.radbuttFILL \
.fRright.fRbuttons.radbuttOUTLINE \
.fRright.fRbuttons.radbuttBOTH \
-side left \
-anchor w \
-fill none \
-expand 0
# -side right \
# -anchor e \
# -fill none \
# -expand 0
##+#########################################
## In FRAME '.fRright.fRgridspecs' -
## DEFINE-and-PACK LABEL & ENTRY WIDGETS
## --- for x-range and y-range (the 'domain'
## of the 2 independent variables) --- and
## for Nxsegs and Nysegs (the number of segments
## into which to break the x and y sides of the
## domain rectangle).
##+#########################################
label .fRright.fRgridspecs.labelGRID \
-text "$aRtext(labelGRID)" \
-font fontTEMP_varwidth \
-justify left \
-anchor w \
-relief flat \
-bd 0
label .fRright.fRgridspecs.labelXMIN \
-text "$aRtext(labelXMIN)" \
-font fontTEMP_varwidth \
-justify left \
-anchor w \
-relief flat \
-bd 0
## We set the initial value for this entry widget in the
## GUI initialization section at the bottom of this script.
# set ENTRYxmin "-10."
entry .fRright.fRgridspecs.entXMIN \
-textvariable ENTRYxmin \
-bg $entryBKGD \
-font fontTEMP_fixedwidth \
-width $xyrangevarEntryWidthChars \
-relief sunken \
-bd $BDwidthPx_entry
label .fRright.fRgridspecs.labelXMAX \
-text "$aRtext(labelXMAX)" \
-font fontTEMP_varwidth \
-justify left \
-anchor w \
-relief flat \
-bd 0
## We set the initial value for this entry widget in the
## GUI initialization section at the bottom of this script.
# set ENTRYxmax "10."
entry .fRright.fRgridspecs.entXMAX \
-textvariable ENTRYxmax \
-bg $entryBKGD \
-font fontTEMP_fixedwidth \
-width $xyrangevarEntryWidthChars \
-relief sunken \
-bd $BDwidthPx_entry
label .fRright.fRgridspecs.labelXSEGS \
-text "$aRtext(labelXSEGS)" \
-font fontTEMP_varwidth \
-justify left \
-anchor w \
-relief flat \
-bd 0
## We set the initial value for this entry widget in the
## GUI initialization section at the bottom of this script.
# set ENTRYxsegs 10
entry .fRright.fRgridspecs.entXSEGS \
-textvariable ENTRYxsegs \
-bg $entryBKGD \
-font fontTEMP_fixedwidth \
-width $xyrangevarEntryWidthChars \
-relief sunken \
-bd $BDwidthPx_entry
## AND THE WIDGETS FOR YMIN,YMAX,YSEGS.
label .fRright.fRgridspecs.labelYMIN \
-text "$aRtext(labelYMIN)" \
-font fontTEMP_varwidth \
-justify left \
-anchor w \
-relief flat \
-bd 0
## We set the initial value for this entry widget in the
## GUI initialization section at the bottom of this script.
# set ENTRYymin "-10."
entry .fRright.fRgridspecs.entYMIN \
-textvariable ENTRYymin \
-bg $entryBKGD \
-font fontTEMP_fixedwidth \
-width $xyrangevarEntryWidthChars \
-relief sunken \
-bd $BDwidthPx_entry
label .fRright.fRgridspecs.labelYMAX \
-text "$aRtext(labelYMAX)" \
-font fontTEMP_varwidth \
-justify left \
-anchor w \
-relief flat \
-bd 0
## We set the initial value for this entry widget in the
## GUI initialization section at the bottom of this script.
# set ENTRYymax "10."
entry .fRright.fRgridspecs.entYMAX \
-textvariable ENTRYymax \
-bg $entryBKGD \
-font fontTEMP_fixedwidth \
-width $xyrangevarEntryWidthChars \
-relief sunken \
-bd $BDwidthPx_entry
label .fRright.fRgridspecs.labelYSEGS \
-text "$aRtext(labelYSEGS)" \
-font fontTEMP_varwidth \
-justify left \
-anchor w \
-relief flat \
-bd 0
## We set the initial value for this entry widget in the
## GUI initialization section at the bottom of this script.
# set ENTRYysegs 10
entry .fRright.fRgridspecs.entYSEGS \
-textvariable ENTRYysegs \
-bg $entryBKGD \
-font fontTEMP_fixedwidth \
-width $xyrangevarEntryWidthChars \
-relief sunken \
-bd $BDwidthPx_entry
##+##################################################
## Pack the '.fRright.fRgridspecs' frame's widgets
## --- for entering xmin,xmax,Nxsegs,ymin,ymax,Nysegs.
##+##################################################
pack .fRright.fRgridspecs.labelGRID \
-side left \
-anchor w \
-fill none \
-expand 0
pack .fRright.fRgridspecs.labelXMIN \
-side left \
-anchor w \
-fill none \
-expand 0
pack .fRright.fRgridspecs.entXMIN \
-side left \
-anchor w \
-fill x \
-expand 1
pack .fRright.fRgridspecs.labelXMAX \
-side left \
-anchor w \
-fill none \
-expand 0
pack .fRright.fRgridspecs.entXMAX \
-side left \
-anchor w \
-fill x \
-expand 1
pack .fRright.fRgridspecs.labelXSEGS \
-side left \
-anchor w \
-fill none \
-expand 0
pack .fRright.fRgridspecs.entXSEGS \
-side left \
-anchor w \
-fill x \
-expand 1
## FOR Y:
pack .fRright.fRgridspecs.labelYMIN \
-side left \
-anchor w \
-fill none \
-expand 0
pack .fRright.fRgridspecs.entYMIN \
-side left \
-anchor w \
-fill x \
-expand 1
pack .fRright.fRgridspecs.labelYMAX \
-side left \
-anchor w \
-fill none \
-expand 0
pack .fRright.fRgridspecs.entYMAX \
-side left \
-anchor w \
-fill x \
-expand 1
pack .fRright.fRgridspecs.labelYSEGS \
-side left \
-anchor w \
-fill none \
-expand 0
pack .fRright.fRgridspecs.entYSEGS \
-side left \
-anchor w \
-fill x \
-expand 1
##+################################################
## In FRAME '.fRright.fRviewparms' -
## DEFINE-and-PACK a pair of LABEL & SCALE WIDGETS
## --- for 2 rotation angles, longitude & latitude.
##
## Also provide a label widget in which to
## show help and/or 'status' info.
##+################################################
label .fRright.fRviewparms.labelVIEW \
-text "$aRtext(labelVIEW)" \
-font fontTEMP_varwidth \
-justify left \
-anchor w \
-relief flat \
-bd 0
## We will set initial values for the
## following 2 scales in the
## additional-GUI-initialization section
## at the bottom of this script.
## This 'scaleLON' is for the longitudinal angle,
## which we allow to range from 0 to 360 degrees.
scale .fRright.fRviewparms.scaleLON \
-orient horizontal \
-resolution 1 \
-from 0 -to 360 \
-digits 4 \
-length 180 \
-repeatdelay 500 \
-repeatinterval 50 \
-font fontTEMP_varwidth \
-troughcolor "$scaleBKGD"
# -label "$aRtext(scaleLON)" \
# -command {rotate_proJECT}
## We do NOT use the '-variable' option.
## It may cause 'auto-repeat' problems.
# -variable angLON \
## This 'scaleLAT' is for the latitudinal angle,
## which we allow to range from 0 to 180 degrees.
scale .fRright.fRviewparms.scaleLAT \
-orient horizontal \
-resolution 1 \
-from -90 -to 90 \
-digits 3 \
-length 90 \
-repeatdelay 500 \
-repeatinterval 50 \
-font fontTEMP_varwidth \
-troughcolor "$scaleBKGD"
# -from 0 -to 180 \
# -label "$aRtext(scaleLAT)" \
# -command {rotate_proJECT}
## We do NOT use the '-variable' option.
## It may cause 'auto-repeat' problems.
# -variable viewZ \
label .fRright.fRviewparms.labelSTATUS \
-text "\
$numfuncs functions are in the listbox. Select one or enter your own below.
You can change values for func-coeffs, grid, view, zoom. Press Enter
when in an entry field (or MouseButn3-click an entry field) to replot." \
-font fontTEMP_SMALL_varwidth \
-justify left \
-anchor w \
-relief flat \
-bd $BDwidthPx_button
##+###############################################
## Pack the '.fRright.fRviewparms' frame's widgets
## --- for projection vector and help/status info.
##+###############################################
pack .fRright.fRviewparms.labelVIEW \
-side left \
-anchor w \
-fill none \
-expand 0
pack .fRright.fRviewparms.scaleLON \
.fRright.fRviewparms.scaleLAT \
-side left \
-anchor w \
-fill none \
-expand 0
pack .fRright.fRviewparms.labelSTATUS \
-side left \
-anchor w \
-fill none \
-expand 0
##+###############################
## In FRAME '.fRright.fRfunction' -
## DEFINE-and-PACK LABEL & ENTRY.
##+###############################
label .fRright.fRfunction.labelFUNC \
-text "$aRtext(labelFUNCTION)" \
-font fontTEMP_varwidth \
-justify left \
-anchor w \
-relief flat \
-bd 0
## We set an initial function in the GUI initialization
## section at the bottom of this script. Example:
## set ENTRYfunction {($x*$x)*($y*$y)}
entry .fRright.fRfunction.entFUNC \
-textvariable ENTRYfunction \
-bg $entryBKGD \
-font fontTEMP_fixedwidth \
-width $initFuncEntryWidthChars \
-relief sunken \
-bd $BDwidthPx_entry
## Pack the function widgets.
pack .fRright.fRfunction.labelFUNC \
-side left \
-anchor w \
-fill none \
-expand 0
pack .fRright.fRfunction.entFUNC \
-side left \
-anchor w \
-fill x \
-expand 1
##+###############################
## In FRAME '.fRright.fRcan' -
## DEFINE-and-PACK a CANVAS WIDGET:
##+###############################
## We set '-highlightthickness' and '-borderwidth' to
## zero, to avoid covering some of the viewable area
## of the canvas, as suggested on page 558 of the 4th
## edition of 'Practical Programming with Tcl and Tk'.
##+###################################################
canvas .fRright.fRcan.can \
-width $initCanWidthPx \
-height $initCanHeightPx \
-relief raised \
-highlightthickness 0 \
-borderwidth 0
pack .fRright.fRcan.can \
-side top \
-anchor nw \
-fill both \
-expand 1
##+##################################################
## END OF DEFINITION of the GUI widgets.
##+##################################################
## Start of BINDINGS, PROCS, Added-GUI-INIT sections.
##+##################################################
##+#######################################################################
##+#######################################################################
## BINDINGS SECTION:
## - For MB1-release on a listbox line,
## put that line (function) in ENTRYfunction.
##
## - For Enter-key-press on any of the xmin,xmax,xsegs,ymin,ymax,ysegs
## entry fields, call the 4 procs that do a complete redraw.
##
## - For MB1-release on any of the xmin,xmax,xsegs,ymin,ymax,ysegs
## entry fields, call the 4 procsthat do a complete redraw.
##
## Also bindings on the longitude-latitude scale widgets.
## Also bindings on fill/outline/both radiobuttons and on the zoom scale.
##+#######################################################################
## A sequence of up to 4 procs may be used to perform a draw:
## - load_points_array
## - translate_points_array
## - rotate_points
## - draw_2D_pixel_polys
## The bindings on the 'entFUNC' widget would do all 4: load-translate-rotate-draw.
## The bindings on the xmin,...,ysegs entry fields would do all 4.
## The bindings on the longitude-latitude scales would do the last 2: rotate-draw.
## The bindings on the fill/outline/both radiobutons would do the last 1: draw.
## The binding on the zoom scale would do the last 1.
## The fill and outline color button procs would do the last 1.
##+#######################################################################
bind .fRleft.fRlistbox.listbox <ButtonRelease-1> { listboxSelectionTOentryString }
bind .fRright.fRfunction.entFUNC <Return> "load-translate-rotate-draw"
bind .fRright.fRfunction.entFUNC <ButtonRelease-3> "load-translate-rotate-draw"
bind .fRright.fRgridspecs.entXMIN <Return> "load-translate-rotate-draw"
bind .fRright.fRgridspecs.entXMIN <ButtonRelease-3> "load-translate-rotate-draw"
bind .fRright.fRgridspecs.entXMAX <Return> "load-translate-rotate-draw"
bind .fRright.fRgridspecs.entXMAX <ButtonRelease-3> "load-translate-rotate-draw"
bind .fRright.fRgridspecs.entXSEGS <Return> "load-translate-rotate-draw"
bind .fRright.fRgridspecs.entXSEGS <ButtonRelease-3> "load-translate-rotate-draw"
bind .fRright.fRgridspecs.entYMIN <Return> "load-translate-rotate-draw"
bind .fRright.fRgridspecs.entYMIN <ButtonRelease-3> "load-translate-rotate-draw"
bind .fRright.fRgridspecs.entYMAX <Return> "load-translate-rotate-draw"
bind .fRright.fRgridspecs.entYMAX <ButtonRelease-3> "load-translate-rotate-draw"
bind .fRright.fRgridspecs.entYSEGS <Return> "load-translate-rotate-draw"
bind .fRright.fRgridspecs.entYSEGS <ButtonRelease-3> "load-translate-rotate-draw"
bind .fRright.fRviewparms.scaleLON <ButtonRelease-1> "rotate-draw"
bind .fRright.fRviewparms.scaleLAT <ButtonRelease-1> "rotate-draw"
bind .fRright.fRbuttons.radbuttFILL <ButtonRelease-1> "wrap_draw_2D_pixel_polys"
bind .fRright.fRbuttons.radbuttOUTLINE <ButtonRelease-1> "wrap_draw_2D_pixel_polys"
bind .fRright.fRbuttons.radbuttBOTH <ButtonRelease-1> "wrap_draw_2D_pixel_polys"
## Using <ButtonRelease-1> for redraws on changing the zoom
## causes the scale to 'go crazy' if you click in the trough.
## (Note that this was when the 'scaleZOOM' widget was packed with
## '-fill x -expand 1' and with a <Configure> binding on the canvas.)
## The sliderbar keeps advancing on its own and many redraws are done.
## The 'break' here does not help.
## So lets try a <Leave> binding instead. But we need something better.
## The user is going to tend to leave the mouse cursor over the
## scale and expect something to happen when he/she releases the button.
##
## <Leave> on a scale is weird. If you drag the slider bar, you DO
## need to leave to cause the redraw. But if you click in the trough,
## each click causes a redraw, as if the user leaves on each click
## of the trough. But it is one zoom value behind on each click ..
## i.e. the first click on the trough does not do anything.
# bind .fRleft.fRzoom.scaleZOOM <ButtonRelease-1> "wrap_draw_2D_pixel_polys;break"
bind .fRleft.fRzoom.scaleZOOM <ButtonRelease-1> "wrap_draw_2D_pixel_polys"
# bind .fRleft.fRzoom.scaleZOOM <Leave> "wrap_draw_2D_pixel_polys"
## If var curZOOM changes, do a redraw.
# trace add variable curZOOM write "wrap_draw_2D_pixel_polys"
##+##################################################################
##+##################################################################
## DEFINE PROCS SECTION:
##
## - 'listboxSelectionTOentryString' -
## Puts a user-selected function-listbox line
## into the entry widget var, ENTRYfunction.
##
## - 'load_points_array' - (step1)
## For a given function of $x,$y in the function
## entry field, this proc builds a Tcl array of
## values of the form aRpoints($i,$j) = [list $x $y $z]
## where z is evaluated from the user-specified function
## and the x,y grid is determined from 6 entry field values.
##
## While loading the array, we find the min,max values of
## the xyz coords and use these to calculate midx,midy,midz values.
##
## - 'translate_points_array' - (step2)
## For the array aRpoints($i,$j) = [list $x $y $z],
## we calculate a new array in Cartesian coordinates:
## aRtranspoints($i,$j) = [list $transx $transy $transz]
## based at the midpoint of the min-max ranges of xyz.
##
## (Note that the xyz values could be far from the origin
## in 3-space --- 0,0,0. So we need to translate the 'center
## point' of the plot data to the middle of the data cloud.
## I.e. we may be rotating the data around a point far
## from the origin 0,0,0.)
##
## We could use the array 'aRpoints' to hold the translated
## coordinates, but we will use some memory just in case we
## find it useful to have the original point values available
## --- for example for coloring the polygons according to
## the original data values.
##
## - 'rotate_points' - (step3)
## For a given longitude and latitude (view direction),
## this proc loops thru all the POINTS, in array aRtranspoints,
## rotating each point according to the current 2 longitude
## and latitude angles --- angLON,angLAT --- and calculating
## the new Cartesian (xyz) coordinates. The xyz data for
## the 'new points' are put into a new array, 'aRnew_points'.
##
## Thus if we make a 'simple' change like fill or outline color,
## or change to wireframe mode from fill mode (changes that do
## not change the function, grid, or view direction),
## we do not have to go through a lot of mathematical
## calculations again. We can work off of the 'aRnew_points' array.
##
## We are using memory for 3 arrays --- aRpoints, aRtranspoints,
## and aRnew_points --- to give us some processing efficiency
## when we make changes that should not require sweeping through
## the grid and performing math calculations that we have already
## done once.
##
## Because the canvas area will usually be no more than about
## 900x900 pixels, and the smallest polygons we will want will
## be about 3 pixels across, we will probably break up the
## rectangular grid into no more than about 300x300 segments.
## This would mean we generally have no more than about
## 3x300x300 = 270,000 xyz coords per array. At about 8bytes per
## coord, this means about 8x270000 = 2.16 Megabytes per array.
## For 3 arrays, this is about 6.5 Megabytes for the 3 arrays.
## Since most computers nowadays will have at least 1 Gigabyte
## = 1,000 Megabytes of memory available if no more than the
## basic operating system tasks are running, this means that
## less than 1% of the free memory will be used by the 3 arrays.
##
## - 'draw_2D_pixel_polys' - (step4)
## For the current aRnew_points array, this proc maps
## the x,z values of the 4 corners of the quadrilaterals
## into pixels and the polygons are placed on the current
## Tk canvas area with 'create polygon' commands --- with
## the requested '-fill' and '-outline' options and the requested
## color values.
##
## The initial mapping of world-units to pixels is based on
## mapping the canvas dimensions into world-units of at least
## 10% more than the diameter of the data cloud of x,y,f(x,y) points.
##
## Zooming logic is located solely in this proc.
##
## Note that the procs that built the arrays aRpoints,
## aRtranspoints, and aRnew_points are all dealing with 'world
## coordinates'. 'draw_2D_pixel_polys' is the only proc
## dealing with pixel coordinates.
##
## - 'load-translate-rotate-draw' -
## a proc that calls 4 procs:
## - load_points_array
## - translate_points_array
## - rotate_points
## - draw_2D_pixel_polys
## and also shows the draw-time (millisecs).
##
## - 'rotate-draw' -
## a proc that calls 2 procs:
## - rotate_points
## - draw_2D_pixel_polys
## and also shows the draw-time (millisecs).
##
##
## - 'wrap_draw_2D_pixel_polys' -
## a proc that calls 1 proc:
## - draw_2D_pixel_polys
## and also shows the draw-time (millisecs).
##
## - 'update_status_label' - shows the draw-time (millsecs) in a label
##
## - 'set_polygon_color1' - sets fill color for the polygons
## - 'set_polygon_color2' - sets outline color for the polygons
## - 'set_background_color' - sets background (canvas) color
## - 'update_colors_label' - to color buttons and reset a colors label
##
## - 'popup_msg_var_scroll' - to show Help text (and perhaps other msgs)
##+#################################################################
## We set some 'universal' constants that will be used in the 'rotate_points'
## proc --- and may be used in the proc 'listboxSelectionTOentryString' or
## in the ENTRYfunction variable.
set pi [expr {4.0 * atan(1.0)}]
set twopi [expr { 2.0 * $pi }]
# set pihalf [expr { $pi / 2.0 }]
# set minuspihalf [expr {-$pihalf}]
##+#####################################################################
## proc listboxSelectionTOentryString
##
## PURPOSE: Puts the selected listbox line into the ENTRYfunction var.
##
## CALLED BY: binding on button1-release on the listbox
##+#####################################################################
proc listboxSelectionTOentryString {} {
global ENTRYfunction
set sel_index [ .fRleft.fRlistbox.listbox curselection ]
if { $sel_index != "" } {
set ENTRYfunction [ .fRleft.fRlistbox.listbox get $sel_index ]
}
## We should at least load the points array, to be ready if a redraw
## is triggered by any of the bindings.
# load_points_array
## But, for convenience and speed, we go ahead an do the entire
## sequence for drawing the function on the canvas.
load-translate-rotate-draw
}
## END of 'listboxSelectionTOentryString' proc
##+#####################################################################
## proc load_points_array
##
## PURPOSE: For a given function of $x,$y in the function entry field,
## this proc builds a Tcl array of values of the form
## aRpoints($i,$j) = [list $x $y $z]
## where z is evaluated from the user-specified function
## and the x,y grid is determined from 6 entry field values.
##
## This can save some computing by avoiding re-computing z for
## each x,y in the grid everytime a redraw is triggered and
## the function and grid have not changed.
## This is especially beneficial for a large grid and/or
## a lot of redraws.
##
## While loading the array, we find the min,max values of
## the xyz coords and use these to calculate Xmid,Ymid,Zmid values.
##
## CALLED BY: <Return> or button3-release binding on the function
## entry field and in the GUI initialization section
## at the bottom of this script
##+#####################################################################
proc load_points_array {} {
global ENTRYfunction \
ENTRYxmin ENTRYxmax ENTRYxsegs \
ENTRYymin ENTRYymax ENTRYysegs \
aRpoints minZ maxZ Xmid Ymid Zmid diam twopi pi
## Set the x and y grid-increment amounts, in world coords.
set lenx [expr {$ENTRYxmax - $ENTRYxmin}]
set leny [expr {$ENTRYymax - $ENTRYymin}]
set DELx [expr {$lenx / double($ENTRYxsegs)}]
set DELy [expr {$leny / double($ENTRYysegs)}]
##################################################################
## Start looping thru the rectangular grid over integers i,j.
## For each i,j:
## set coords x,y,z = x,y,f(x,y) --- coords of a 3D point on
## the surface that we are plotting --- and store the 3 coords
## in array aRpoints via aRpoints($i,$j).
## We also collect minZ and maxZ.
##
## We are following the advice of the 'Practical Programming in
## Tcl & Tk' book, 4th edition, by Welch,Jones,Hobbs on page 96:
## "If you have complex indices, use a comma to separate different
## parts of the index. If you use a space in an index instead,
## then you have a quoting problem."
###################################################################
set x $ENTRYxmin
set y $ENTRYymin
for {set j 0} {$j <= $ENTRYysegs} {incr j} {
for {set i 0} {$i <= $ENTRYxsegs} {incr i} {
## Evaluate z from f(x,y).
# set z [expr $ENTRYfunction]
set z [eval expr {$ENTRYfunction}]
## LOAD THE 'aRpoints' ARRAY.
set aRpoints($i,$j) [list $x $y $z]
## Set the minZ,maxZ values of the points.
## We use these values in the TESTING 'puts' statements below.
if {$i == 0 && $j == 0} {
set minZ $z
set maxZ $z
} else {
if {$z < $minZ} {set minZ $z}
if {$z > $maxZ} {set maxZ $z}
}
## END OF if {$i == 0 && $j == 0}
set x [expr {$x + $DELx}]
}
## END OF i loop
set y [expr {$y + $DELy}]
set x $ENTRYxmin
}
## END OF j loop
## Get the mid-points of the x,y,z ranges.
set Xmid [expr {($ENTRYxmax + $ENTRYxmin) / 2.0}]
set Ymid [expr {($ENTRYymax + $ENTRYymin) / 2.0}]
set Zmid [expr {($maxZ + $minZ) / 2.0}]
## Calculate a diameter for our 'cloud' of data points.
set diam [expr {$ENTRYxmax - $ENTRYxmin}]
set maxDeltaY [expr {$ENTRYymax - $ENTRYymin}]
if {$maxDeltaY > $diam} {set diam $maxDeltaY}
set maxDeltaZ [expr {$maxZ - $minZ}]
if {$maxDeltaZ > $diam} {set diam $maxDeltaZ}
## FOR TESTING:
# set NUMgridpts [expr {($ENTRYxsegs + 1) * ($ENTRYysegs + 1)}]
# puts "proc 'load_points_array' > $NUMgridpts grid points in array. Some loaded points:"
# puts " aRpoints(0,0): $aRpoints(0,0)"
# puts " aRpoints($ENTRYxsegs,$ENTRYysegs): $aRpoints($ENTRYxsegs,$ENTRYysegs)"
# puts "Extreme z-values of the loaded points:"
# puts " minZ: $minZ maxZ: $maxZ"
# puts "Middle values of the loaded points:"
# puts " Xmid: $Xmid Ymid: $Ymid Zmid: $Zmid"
# puts "Max Diameter of the loaded points - diam: $diam"
}
## END OF PROC load_points_array
##+#####################################################################
## proc translate_points_array
##
## PURPOSE: For the array aRpoints($i,$j) = [list $x $y $z],
## we calculate a new array in Cartesian coordinates:
## aRtranspoints($i,$j) = [list $transx $transy $transz]
## based at the midpoint of the min-max ranges of xyz.
##
## (Note that the xyz values could be far from the origin
## in 3-space --- 0,0,0. So we need to translate the 'center
## point' of the plot data to the middle of the data cloud.
## I.e. we may be rotating the data around a point far
## from the origin 0,0,0.)
##
## We could use the array 'aRpoints' to hold the translated
## coordinates, but we will use some memory just in case we
## find it useful to have the original point values available
## --- for example for coloring the polygons according to
## the original data values.
##
## CALLED BY: <Return> or button3-release binding on the function
## entry field and in the GUI initialization section
## at the bottom of this script
##+#####################################################################
proc translate_points_array {} {
global aRpoints aRtranspoints \
ENTRYxmin ENTRYxmax ENTRYxsegs \
ENTRYymin ENTRYymax ENTRYysegs \
Xmid Ymid Zmid
##################################################################
## Start looping thru the rectangular grid over integers i,j.
## For each i,j:
## get coords x,y,z from array 'aRpoints' , translate them
## to coordinates relative to Xmid,Ymid,Zmid.
## Put the translated values into array aRtranspoints such that
## aRtranspoints($i,$j) = [list $transx $transy $transz]
###################################################################
for {set j 0} {$j <= $ENTRYysegs} {incr j} {
for {set i 0} {$i <= $ENTRYxsegs} {incr i} {
## Get the xyz coords from aRpoints($i,$j).
foreach {x y z} $aRpoints($i,$j) {break}
## Translate the xyz coords to the mid-point of the data.
set transx [expr {$x - $Xmid}]
set transy [expr {$y - $Ymid}]
set transz [expr {$z - $Zmid}]
## HERE IS where we load array aRtranspoints.
set aRtranspoints($i,$j) [list $transx $transy $transz]
}
## END OF i loop
}
## END OF j loop
## FOR TESTING:
# puts "proc 'translate_points_array' > After i,j loop - some translated points :"
# puts "aRtranspoints(0,0): $aRtranspoints(0,0)"
# puts "aRtranspoints($ENTRYxsegs,$ENTRYysegs): $aRtranspoints($ENTRYxsegs,$ENTRYysegs)"
}
## END OF PROC translate_points_array
##+###################################################################################
## proc 'rotate_points'
##
## PURPOSE: For a given longitude and latitude (view direction),
## this proc loops thru all the POINTS, in array aRtranspoints,
## rotating each point according to the current 2 longitude
## and latitude angles --- angLON,angLAT --- and calculating
## the new Cartesian (xyz) coordinates. The xyz data for
## the 'new points' are put into a new array, 'aRnew_points'.
##
## Thus if we make a 'simple' change like fill or outline color,
## or change to wireframe mode from fill mode (changes that do
## not change the function, grid, or view direction),
## we do not have to go through a lot of mathematical
## calculations again. We can work off of this 'aRnew_points' array.
##
## We are using memory for 3 arrays --- aRpoints, aRtranspoints,
## and aRnew_points --- to give us some processing efficiency
## when we make changes that should not require sweeping through
## the grid and performing math calculations that we have already
## done once.
##
## CALLED BY: <Return> or button3-release binding on the function
## entry field and in the GUI initialization section
## at the bottom of this script
##+#####################################################################
set radsPERdeg [expr { $twopi / 360 }]
proc rotate_points {} {
global radsPERdeg ENTRYxsegs ENTRYysegs aRtranspoints aRnew_points
## We may calculate new min,max values for use in the draw-pixels routine.
# minnewX maxnewX minnewY maxnewY minnewZ maxnewZ
## Get the 2 rotation angles (in degrees).
set angLON [.fRright.fRviewparms.scaleLON get]
set angLAT [.fRright.fRviewparms.scaleLAT get]
## Convert the 2 rotation angles from degrees to radians.
set angLON [expr {$radsPERdeg * $angLON}]
set angLAT [expr {$radsPERdeg * $angLAT}]
## THIS IS THE STEP WE HAVE BEEN LEADING UP TO ---
## THE ACTUAL ROTATION OF EACH 3D POINT --- done via a
## Ry * Rz rotation matrix --- a product of a longitudinal rotation about
## the z-axis, followed by a latitudinal rotation about the y-axis.
##
## z| . (x,y,f(x,y))
## | .
## | . angLAT
## |___________________y
## / .
## / .
## / angLON .
## x /
##
## Referring to computer graphics notes such as 'Draft Lecture Notes:
## Computer Graphics for Engineers', by Victor Saouma, U. of Colorado,
## 2000, page 24:
## If we rotate a model/point around the z and then y axes,
## by angles 'thetaz' and 'thetay' resp., and if we let
## cz=cos(thetaz),sz=sin(thetaz),cy=cos(thetay),sy=sin(thetay),
## the product of the 2 rotation matrices is
##
## | cy 0 sy | | cz -sz 0 |
## Ry.Rz = | 0 1 0 | | sz cz 0 |
## | -sy 0 cy | | 0 0 1 |
##
## | cy.cz -cy.sz sy |
## = | sz cz 0 |
## | -sy.cz sy.sz cy |
##
## To reduce the number of math operations in rotating each point,
## we pre-compute the 4 products and denote them as
## cycz, cysz, sycz, sysz.
##
## Then
## newx = cycz * x - cysz * y + sy * z
## newy = sz * x + cz * y
## newz = -sycz * x + sysz * y + cy * z
## Note that 'thetaz' and 'thetay' (the amounts to rotate the points),
## are related to the view angles in our case.
##
## angLON (an angle in the xy plane) is the longitudinal view angle, and
## angLAT (ordinarily an angle from the xy plane toward the z axis) is
## what we are calling the latitudinal view angle.
##
## We let angLON be 'thetaz' and angLAT be 'thetay', up to the sign.
##
## For 'thetaz' and 'thetay', we adjust the view angles, as needed, by
## a negative sign to get an 'appropriate' rotation of the point cloud.
set cy [expr {cos($angLAT)}]
set sy [expr {sin($angLAT)}]
set cz [expr {cos(-$angLON)}]
set sz [expr {sin(-$angLON)}]
set cycz [expr {$cy * $cz}]
set cysz [expr {$cy * $sz}]
set sycz [expr {$sy * $cz}]
set sysz [expr {$sy * $sz}]
##################################################################
## Start looping thru the rectangular grid over integers i,j.
## For each i,j:
## - get coords transx,transy,transz from array 'aRtranspoints'
## - apply the rotation matrix RyRz to the point
## to calculate the new Cartesian coords newX,newY,newZ
## - store the values in the new-points array
## aRnew_points($i,$j) = [list $newX $newY $newZ]
###################################################################
for {set j 0} {$j <= $ENTRYysegs} {incr j} {
for {set i 0} {$i <= $ENTRYxsegs} {incr i} {
## Get the cartesian coords from aRtranspoints($i,$j).
foreach {transx transy transz} $aRtranspoints($i,$j) {break}
## Calc the new Cartesian coords using
## newx = cycz * x - cysz * y + sy * z
## newy = sz * x + cz * y
## newz = -sycz * x + sysz * y + cy * z
set newX [expr { ($cycz * $transx) - ($cysz * $transy) + ($sy * $transz) }]
set newY [expr { ($sz * $transx) + ($cz * $transy) }]
set newZ [expr { (-$sycz * $transx) + ($sysz * $transy) + ($cy * $transz) }]
## FOR TESTING:
# puts "proc 'rotate_points' > For POINT $i,$j, the new rotated-translated point is:"
# puts " newX: $newX newY: $newY newZ: $newZ"
## HERE IS where we load array aRnew_points.
set aRnew_points($i,$j) [list $newX $newY $newZ]
}
## END OF i loop
}
## END OF j loop
## FOR TESTING:
# puts "proc 'rotate_points' > After i,j loop - some roated points :"
# puts " aRnew_points(0,0): $aRnew_spoints(0,0)"
# puts " aRnew_points($ENTRYxsegs,$ENTRYysegs): $aRnew_points($ENTRYxsegs,$ENTRYysegs)"
}
## END OF PROC 'rotate_points'
##+###########################################################
## proc draw_2D_pixel_polys -
##
## PURPOSE:
## For the data array aRnew_points($i,$j),
## we loop through the rectangular grid (starting at a corner
## determined by the current view angle, in particular the
## longitude, an angle in the xy plane) plotting the polygons
## on the canvas.
##
## For our projection on a viewing plane:
## Rather than using the x,y coords of our rotated points (and
## ignoring the z coord), we use the y,z coords of our rotated
## points (and 'ignore' the x coord). Then for longitude,latitude
## (0,0) --- where the x-axis is out of the screen (viewport),
## and longitude goes from 0 to 360 degrees from the x axis
## toward the y axis, and latitude goes from -90 to +90 degrees
## from the xy plane toward the z axis --- we get a 'front view'
## (perpendicular to the yz plane).
##
## (0,90) gives us a 'top view' (a view perpendicular to the xy plane)
## and (90,0) gives us a 'side view' (a view perpendicular to the
## xz plane.
##
## (We could add an x-sort eventually, to plot
## the 'farther-away' polygons first --- instead of
## starting at a certain corner of the rectangular grid
## determined from the longitude angle.)
##
## We convert the 2D points from 'world coordinate' units to
## pixel units within the current canvas dimensions --- based
## on the 'diameter of the point cloud' as determined in the
## proc 'load_points_array'. Then ...
##
## draw polygons using groups of 4 2D points at a time, and
## based on the fill/outline/both radiobuttons of the GUI and
## colors set by the color-buttons of the GUI.
##
## In addition, we use the curZOOM variable from the 'scaleZOOM'
## widget of the GUI to allow for zooming (by adjusting the
## 'diameter of the point cloud').
##
## INPUTS:
## All the global vars declared below.
##
## CALLED BY: <Return> or button3-release binding on the function
## entry field and in the GUI initialization section
## at the bottom of this script --- and on any change
## to the fill/outline/both radiobuttons or by use of
## the color-buttons to make a color change.
##+#########################################################
set TOLcheck 0.05
proc draw_2D_pixel_polys {} {
global aRnew_points ENTRYxsegs ENTRYysegs diam \
COLOR1hex COLOR2hex COLORbkGNDhex \
poly_filloutboth curZOOM \
COLOR1r COLOR1g COLOR1b minZ maxZ TOLcheck aRpoints
## The following could be used if we set min,max values
## for xyz in the 'rotate_points' proc. COMMENTED FOR NOW.
##
## Set the approximate diameter of the model (surface).
# set deltaX [expr {$maxnewX - $minnewX}]
# set deltaY [expr {$maxnewY - $minnewY}]
# set deltaZ [expr {$maxnewZ - $minnewZ}]
# set diam $deltaX
# if {$deltaY > $diam} {set diam $deltaY}
# if {$deltaZ > $diam} {set diam $deltaZ}
## BEFORE the loop to plot POLYGONS,
## we get the PIXELS-PER-WORLD-UNITS CONVERSION FACTOR,
## by dividing the minimum canvas dimension by
## $curZOOM times the model/surface diameter, where curZOOM
## is allowed to go from about 0.1 to 10.
## Get the current canvas size.
set curCanWidthPx [winfo width .fRright.fRcan.can]
set curCanHeightPx [winfo height .fRright.fRcan.can]
set minCanDimPx $curCanWidthPx
if {$curCanHeightPx < $minCanDimPx} {set minCanDimPx $curCanHeightPx}
## To preserve distances nicely, we want to use the same
## pixels-per-world-units factor in both x and y directions
## (assuming the pixels are square).
##
## Here, we may intialize curZOOM so that the rotated surface comfortably
## fits into the canvas --- that is, so that the 'plot' is 'set in' from
## the boundary of the canvas.
set PxPerUnit [expr { double( $minCanDimPx / ($curZOOM * $diam) ) }]
# set PxPerUnit [expr { double( ($curZOOM * $minCanDimPx) / $diam ) }]
## Get the half width and height of the canvas rectangle ---
## which serve as the pixel-coordinates of the (near?) center of the plot.
set imgWidthPx $curCanWidthPx
set imgHeightPx $curCanHeightPx
if {$imgWidthPx % 2 == 1} { incr imgWidthPx -1 }
if {$imgHeightPx % 2 == 1} { incr imgHeightPx -1 }
set xmidPx [expr {$imgWidthPx / 2}]
set ymidPx [expr {$imgHeightPx / 2}]
###############################################################
## Set the 'fill' and 'outline' parms that we will use with the
## 'create polygon' commands, in the 'create polygon' loop below.
###############################################################
if { "$poly_filloutboth" == "fill"} {
## For this case, the case of no wireframe on the surface,
## we use a technique like MM used --- to set the color of
## a polygon according to the value of the original z heights
## (average of z heights at the 4 corners), applied to the
## user-selected 'fill' color.
##
## See the loop below in which z1,z2,z3,z4 are extracted
## for each i,j position in the loop.
##
## Set some parms for that routine.
set deltaZ [expr {$maxZ - $minZ}]
set zeroTOL [expr {$TOLcheck * $diam}]
# set Low0to1 0.5
set Low0to1 0.35
# set Low0to1 0.25
# set Low0to1 0.0
if {$deltaZ < $zeroTOL} {
set deltaZ 0.0
} else {
set del0to1delZ [expr {(1.0 - $Low0to1)/$deltaZ}]
}
## The following color setting resulted in one 'blob' of
## solid color. Instead, we set the fill-only color within
## the i,j loop below.
# set COLORparms "-fill $COLOR1hex"
}
if { "$poly_filloutboth" == "outline" } {
## Without setting the fill to the background color,
## we get a wireframe image with no hiding of back polygons.
# set COLORparms "-outline $COLOR2hex"
set COLORparms "-outline $COLOR2hex -fill $COLORbkGNDhex"
}
if { "$poly_filloutboth" == "both" } {
set COLORparms "-outline $COLOR2hex -fill $COLOR1hex"
}
###############################################################
## Get the longitudinal rotation angle (in degrees) ---
## from which we will determine which polygons to 'paint'
## first --- by choosing one of 4 start corners and
## x,y increments/decrements (plus or minus one).
##
## Recall that our positive x-axis is out of the screen, the
## positive y-axis is to the right, and positive z-axis is up.
###############################################################
set angLON [.fRright.fRviewparms.scaleLON get]
# set angLAT [.fRright.fRviewparms.scaleLAT get]
## If the 'eye' is over the 1st quadrant of the xy plane,
## start from the corner in the 3rd quadrant: xmin,ymin which
## is i,j = 0,0.
if {$angLON >= 0 && $angLON <= 90} {
set iStart 0
set jStart 0
set iDelta 1
set jDelta 1
}
## If the 'eye' is over the 2nd quadrant of the xy plane,
## start from the corner in the 4th quadrant: xmax,ymin which
## is i,j = $ENTRYxsegs,0.
if {$angLON >= 90 && $angLON <= 180} {
set iStart [expr {$ENTRYxsegs - 1}]
set jStart 0
set iDelta -1
set jDelta 1
}
## If the 'eye' is over the 3rd quadrant of the xy plane,
## start from the corner in the 1st quadrant: xmax,ymax which
## is i,j = $ENTRYxsegs,$ENTRYysegs.
if {$angLON >= 180 && $angLON <= 270} {
set iStart [expr {$ENTRYxsegs - 1}]
set jStart [expr {$ENTRYysegs - 1}]
set iDelta -1
set jDelta -1
}
## If the 'eye' is over the 4th quadrant of the xy plane,
## start from the corner in the 2nd quadrant: xmin,ymax which
## is i,j = 0,$ENTRYysegs.
if {$angLON >= 270 && $angLON <= 360} {
set iStart 0
set jStart [expr {$ENTRYysegs - 1}]
set iDelta 1
set jDelta -1
}
## Clear the canvas before starting to lay down the new polygons.
.fRright.fRcan.can delete all
##################################################################
## Start looping thru the rectangular grid over integers i,j ---
## letting i,j represent the 'upper-left' (smallest i,j) corner
## of a grid rectangle in the xy plane --- to 'paint' each
## quadrilateral polygon.
## For each i,j:
## - convert the xy coords of array 'aRnew_points' to pixel coords,
## for i,j and i+1,j and i,j+1 and i+1,j+1. (Rather than store
## another array, we convert most points to pixel coords 4 times.)
## - plot each 4-vertex polygon according to requested color settings
## and requested fill/outline setting (fill/outline/both).
##
###################################################################
for {set j $jStart} {$j < $ENTRYysegs && $j >= 0} {incr j $jDelta} {
for {set i $iStart} {$i < $ENTRYxsegs && $i >= 0} {incr i $iDelta} {
## Get the cartesian coords of the 4 corners of the quadrilateral
## from aRnew_points($i,$j). We go 'around' the rectangle.
foreach {x1 y1 z1} $aRnew_points($i,$j) {break}
foreach {x2 y2 z2} $aRnew_points([expr {$i + 1}],$j) {break}
foreach {x3 y3 z3} $aRnew_points([expr {$i + 1}],[expr {$j + 1}]) {break}
foreach {x4 y4 z4} $aRnew_points($i,[expr {$j + 1}]) {break}
if { "$poly_filloutboth" == "fill"} {
if {$deltaZ == 0.0} {
set COLORparms "-fill $COLOR1hex"
} else {
## For the case of no wireframe on the surface and deltaZ > 0,
## we use a technique like MM used --- to set the color of
## a polygon according to the value of the original z heights
## (or average z height at the 4 corners), applied to the
## user-selected 'fill' color. The steps are:
##
## 1) Compute the average of the four z coordinates.
## 2) Compute its "ratio" in the z (min, max) range, a float between
## 0 and 1.
## 3) Use this ratio to map the components of the 'fill' color ---
## COLOR1r COLOR1g COLOR1b --- into a fill color for the polygon.
foreach {origx1 origy1 origz1} $aRpoints($i,$j) {break}
foreach {origx2 origy2 origz2} $aRpoints([expr {$i + 1}],$j) {break}
foreach {origx3 origy3 origz3} $aRpoints([expr {$i + 1}],[expr {$j + 1}]) {break}
foreach {origx4 origy4 origz4} $aRpoints($i,[expr {$j + 1}]) {break}
set diffZ [expr {(($origz1+$origz2+$origz3+$origz4)/4.0) - $minZ}]
set zRatio [expr {($del0to1delZ * $diffZ) + $Low0to1}]
set newCOLOR1r [expr {int($zRatio * $COLOR1r)}]
if {$newCOLOR1r > 255} {set newCOLOR1r 255}
set newCOLOR1g [expr {int($zRatio * $COLOR1g)}]
if {$newCOLOR1g > 255} {set newCOLOR1g 255}
set newCOLOR1b [expr {int($zRatio * $COLOR1b)}]
if {$newCOLOR1b > 255} {set newCOLOR1b 255}
set newCOLOR1hex [format "#%02X%02X%02X" $newCOLOR1r $newCOLOR1g $newCOLOR1b]
## FOR TESTING:
# puts "proc 'draw_2D_pixel_polys' > i: $i j: $j newCOLOR1hex: $newCOLOR1hex"
# puts " newCOLOR1r: $newCOLOR1r newCOLOR1g: $newCOLOR1g newCOLOR1b: $newCOLOR1b"
# puts " z1: $z1 z2: $z2 z3: $z3 z4: $z4"
# puts " minZ: $minZ maxZ: $maxZ zRatio: $zRatio"
set COLORparms "-fill $newCOLOR1hex"
}
## END OF if {$deltaZ == 0.0}
}
## END OF if { "$poly_filloutboth" == "fill"}
## Convert the POLYGON vertex coordinates to pixel values, using the 'PxPerUnit'
## factor determined above. Then add $xmidPx or $ymidPx to account for the
## fact that aRnew_points world-coordinates are relative to (x,y,z)=(0,0,0),
## and (0,0,0) should be positioned in the middle of the canvas.
##
## Note: We are plotting the yz coords about the center of the canvas at
## ($xmidPx,$ymidPx). We are plotting the y coords in the x-direction
## of the canvas and the z coords in the y direction of the canvas.
##
## Note that the y-pixels coords are based at the top of the canvas, yet the
## world-coordinates are based at the bottom. We convert the z-world-coords
## to pixels and then subtract from the canvas height.
set x1Px [expr { round( ($PxPerUnit * $y1) + $xmidPx ) }]
set y1Px [expr { round( $curCanHeightPx - (($PxPerUnit * $z1) + $ymidPx) ) }]
set x2Px [expr { round( ($PxPerUnit * $y2) + $xmidPx ) }]
set y2Px [expr { round( $curCanHeightPx - (($PxPerUnit * $z2) + $ymidPx) ) }]
set x3Px [expr { round( ($PxPerUnit * $y3) + $xmidPx ) }]
set y3Px [expr { round( $curCanHeightPx - (($PxPerUnit * $z3) + $ymidPx) ) }]
set x4Px [expr { round( ($PxPerUnit * $y4) + $xmidPx ) }]
set y4Px [expr { round( $curCanHeightPx - (($PxPerUnit * $z4) + $ymidPx) ) }]
## FOR TESTING:
# puts "proc 'draw_2D_pixel_polys' > In i,j loop - converted the vertex-points to pixel units"
# puts " for POLYGON $i,$j :"
# puts " x1Px: $x1Px y1Px: $y1Px x2Px: $x2Px y2Px: $y2Px"
# puts " x3Px: $x3Px y3Px: $y3Px x4Px: $x4Px y4Px: $y4Px"
## Set the string of xy point pairs to plot with
## the canvas 'create polygon' command.
set XYpairs "$x1Px $y1Px $x2Px $y2Px $x3Px $y3Px $x4Px $y4Px"
## FINALLY, we plot the polygon $i,$j on the canvas.
eval .fRright.fRcan.can create polygon $XYpairs \
$COLORparms -tags TAGpolygon
## We may find use for 'TAGpolygon', for example to delete
## all polygons but leave other canvas objects such as text
## (someday?) on the canvas.
## FOR TESTING: (slow down the drawing of the polygons)
# update
# after 50
}
## END OF i loop
}
## END OF j loop
}
## END OF proc 'draw_2D_pixel_polys'
##+################################################################
## proc load-translate-rotate-draw
##
## PURPOSE: a proc that calls 4 procs:
## - load_points_array
## - translate_points_array
## - rotate_points
## - draw_2D_pixel_polys
##
## CALLED BY: see BINDINGS section above.
##+################################################################
proc load-translate-rotate-draw {} {
global t0
## Set the current time, for determining elapsed
## time for redrawing the 3D plot.
set t0 [clock milliseconds]
load_points_array
translate_points_array
rotate_points
draw_2D_pixel_polys
update_status_label
}
## END OF proc 'load-translate-rotate-draw'
##+################################################################
## proc rotate-draw
##
## PURPOSE: a proc that calls 2 procs:
## - rotate_points
## - draw_2D_pixel_polys
##
## CALLED BY: see BINDINGS section above.
##+################################################################
proc rotate-draw {} {
global t0
## Set the current time, for determining elapsed
## time for redrawing the 3D plot.
set t0 [clock milliseconds]
rotate_points
draw_2D_pixel_polys
update_status_label
}
## END OF proc 'rotate-draw'
##+################################################################
## proc wrap_draw_2D_pixel_polys
##
## PURPOSE: a proc that calls the proc 'draw_2D_pixel_polys'
## and shows the millisecs that the redraw took.
##
## CALLED BY: see BINDINGS section above.
##+################################################################
proc wrap_draw_2D_pixel_polys {} {
global t0
## Set the current time, for determining elapsed
## time for redrawing the 3D plot.
set t0 [clock milliseconds]
draw_2D_pixel_polys
update_status_label
}
## END OF proc 'wrap_draw_2D_pixel_polys'
##+#####################################################################
## proc 'update_status_label'
##+#####################################################################
## PURPOSE: Updates the draw-time (millisecs) in the label widget
## '.fRright.fRviewparms.labelSTATUS'.
##
## ARGUMENTS: none
##
## CALLED BY: the 3 'wrapper' redraw-procs:
## - load-translate-rotate-draw
## - rotate-draw
## - wrap_draw_2D_pixel_polys
##+#####################################################################
proc update_status_label {} {
global numfuncs t0
.fRright.fRviewparms.labelSTATUS configure -text "\
$numfuncs functions are in the listbox. Select one or enter your own below.
You can change values for func-coeffs, grid, view, zoom.
** re-DRAW TIME: [expr {[clock milliseconds] - $t0}] millisecs elapsed" \
}
## END OF PROC 'update_status_label'
##+#####################################################################
## proc 'set_polygon_color1'
##+#####################################################################
## PURPOSE:
##
## This procedure is invoked to get an RGB triplet
## via 3 RGB slider bars on the FE Color Selector GUI.
##
## Uses that RGB value to set a 'fill' color.
##
## Arguments: none
##
## CALLED BY: .fRbuttons.buttCOLOR1 button
##+#####################################################################
proc set_polygon_color1 {} {
global COLOR1r COLOR1g COLOR1b COLOR1hex COLOR1r COLOR1g COLOR1b
# global feDIR_tkguis
## FOR TESTING:
# puts "COLOR1r: $COLOR1r"
# puts "COLOR1g: $COLOR1g"
# puts "COLOR1b: $COLOR1b"
set TEMPrgb [ exec \
./sho_colorvals_via_sliders3rgb.tk \
$COLOR1r $COLOR1g $COLOR1b]
# $feDIR_tkguis/sho_colorvals_via_sliders3rgb.tk \
## FOR TESTING:
# puts "TEMPrgb: $TEMPrgb"
if { "$TEMPrgb" == "" } { return }
scan $TEMPrgb "%s %s %s %s" r255 g255 b255 hexRGB
set COLOR1hex "#$hexRGB"
set COLOR1r $r255
set COLOR1g $g255
set COLOR1b $b255
## Set color of color1 button and update the colors label.
update_colors_label
## Redraw the geometry in the new fill color.
wrap_draw_2D_pixel_polys
}
## END OF proc 'set_polygon_color1'
##+#####################################################################
## proc 'set_polygon_color2'
## (NOT USED yet ; could be used for an outline)
##+#####################################################################
## PURPOSE:
##
## This procedure is invoked to get an RGB triplet
## via 3 RGB slider bars on the FE Color Selector GUI.
##
## Uses that RGB value to ...
##
## Arguments: none
##
## CALLED BY: .fRbuttons.buttCOLOR2 button
##+#####################################################################
proc set_polygon_color2 {} {
global COLOR2r COLOR2g COLOR2b COLOR2hex COLOR2r COLOR2g COLOR2b
# global feDIR_tkguis
## FOR TESTING:
# puts "COLOR2r: $COLOR2r"
# puts "COLOR2g: $COLOR2g"
# puts "COLOR2b: $COLOR2b"
set TEMPrgb [ exec \
./sho_colorvals_via_sliders3rgb.tk \
$COLOR2r $COLOR2g $COLOR2b]
# $feDIR_tkguis/sho_colorvals_via_sliders3rgb.tk \
## FOR TESTING:
# puts "TEMPrgb: $TEMPrgb"
if { "$TEMPrgb" == "" } { return }
scan $TEMPrgb "%s %s %s %s" r255 g255 b255 hexRGB
set COLOR2hex "#$hexRGB"
set COLOR2r $r255
set COLOR2g $g255
set COLOR2b $b255
## Set color of color2 button and update the colors label.
update_colors_label
## Redraw the geometry in the new outline color.
wrap_draw_2D_pixel_polys
}
## END OF proc 'set_polygon_color2'
##+#####################################################################
## proc 'set_background_color'
##+#####################################################################
## PURPOSE:
##
## This procedure is invoked to get an RGB triplet
## via 3 RGB slider bars on the FE Color Selector GUI.
##
## Uses that RGB value to set the color of the canvas ---
## on which all the tagged items (lines) lie.
##
## Arguments: none
##
## CALLED BY: .fRbuttons.buttCOLORbkGND button
##+#####################################################################
proc set_background_color {} {
global COLORbkGNDr COLORbkGNDg COLORbkGNDb COLORbkGNDhex
# global feDIR_tkguis
## FOR TESTING:
# puts "COLORbkGNDr: $COLORbkGNDr"
# puts "COLORbkGNDg: $COLORbkGNDb"
# puts "COLORbkGNDb: $COLORbkGNDb"
set TEMPrgb [ exec \
./sho_colorvals_via_sliders3rgb.tk \
$COLORbkGNDr $COLORbkGNDg $COLORbkGNDb]
# $feDIR_tkguis/sho_colorvals_via_sliders3rgb.tk \
## FOR TESTING:
# puts "TEMPrgb: $TEMPrgb"
if { "$TEMPrgb" == "" } { return }
scan $TEMPrgb "%s %s %s %s" r255 g255 b255 hexRGB
set COLORbkGNDhex "#$hexRGB"
set COLORbkGNDr $r255
set COLORbkGNDg $g255
set COLORbkGNDb $b255
## Set color of background-color button and update the colors label.
update_colors_label
## Set the color of the canvas.
.fRright.fRcan.can config -bg $COLORbkGNDhex
}
## END OF proc 'set_background_color'
##+#####################################################################
## proc 'update_colors_label'
##+#####################################################################
## PURPOSE:
## This procedure is invoked to update the text in a COLORS
## label widget, to show hex values of current color1, color2,
## and background-color settings.
##
## This proc also sets the background color of each of those 3 buttons
## to its current color --- and sets foreground color to a
## suitable black or white color, so that the label text is readable.
##
## Arguments: global color vars
##
## CALLED BY: 3 colors procs:
## 'set_polygon_color1'
## 'set_polygon_color2'
## 'set_background_color'
## and the additional-GUI-initialization section at
## the bottom of this script.
##+#####################################################################
proc update_colors_label {} {
global COLOR1hex COLOR2hex COLORbkGNDhex \
COLOR1r COLOR1g COLOR1b \
COLOR2r COLOR2g COLOR2b \
COLORbkGNDr COLORbkGNDg COLORbkGNDb
.fRright.fRbuttons.labelCOLORS configure -text "\
Poly-Fill-Color - $COLOR1hex
Poly-Outline-Color - $COLOR2hex
Background Color: $COLORbkGNDhex"
.fRright.fRbuttons.buttCOLOR1 configure -bg $COLOR1hex
set sumCOLOR1 [expr {$COLOR1r + $COLOR1g + $COLOR1b}]
if {$sumCOLOR1 > 300} {
.fRright.fRbuttons.buttCOLOR1 configure -fg "#000000"
} else {
.fRright.fRbuttons.buttCOLOR1 configure -fg "#f0f0f0"
}
.fRright.fRbuttons.buttCOLOR2 configure -bg $COLOR2hex
set sumCOLOR2 [expr {$COLOR2r + $COLOR2g + $COLOR2b}]
if {$sumCOLOR2 > 300} {
.fRright.fRbuttons.buttCOLOR2 configure -fg "#000000"
} else {
.fRright.fRbuttons.buttCOLOR2 configure -fg "#f0f0f0"
}
.fRright.fRbuttons.buttCOLORbkGND configure -bg $COLORbkGNDhex
set sumCOLORbkgd [expr {$COLORbkGNDr + $COLORbkGNDg + $COLORbkGNDb}]
if {$sumCOLORbkgd > 300} {
.fRright.fRbuttons.buttCOLORbkGND configure -fg #000000
} else {
.fRright.fRbuttons.buttCOLORbkGND configure -fg #f0f0f0
}
}
## END OF proc 'update_colors_label'
##+#############################################################
## proc ReDraw_if_canvas_resized
##
## CALLED BY: bind .fRright.fRcan.can <Configure>
## at bottom of this script.
##+#############################################################
proc ReDraw_if_canvas_resized {} {
global PREVcanWidthPx PREVcanHeightPx
set CURcanWidthPx [winfo width .fRright.fRcan.can]
set CURcanHeightPx [winfo height .fRright.fRcan.can]
if { $CURcanWidthPx != $PREVcanWidthPx ||
$CURcanHeightPx != $PREVcanHeightPx} {
## WAS: ReDraw 0
wrap_draw_2D_pixel_polys
set PREVcanWidthPx $CURcanWidthPx
set PREVcanHeightPx $CURcanHeightPx
}
}
## END OF ReDraw_if_canvas_resized
##+########################################################################
## PROC 'popup_msg_var_scroll'
##+########################################################################
## PURPOSE: Report help or error conditions to the user.
## CALLED BY: 'help' button
##+########################################################################
## To have more control over the formatting of the message (esp.
## words per line), we use this 'toplevel-text' method,
## rather than the 'tk_dialog' method -- like on page 574 of the book
## by Hattie Schroeder & Mike Doyel,'Interactive Web Applications
## with Tcl/Tk', Appendix A "ED, the Tcl Code Editor".
##+########################################################################
proc popup_msg_var_scroll { VARtext } {
## global fontTEMP_varwidth #; Not needed. 'wish' makes this global.
## global env
# bell
# bell
#################################################
## Set VARwidth & VARheight from $VARtext.
#################################################
## To get VARheight,
## split at '\n' (newlines) and count 'lines'.
#################################################
set VARlist [ split $VARtext "\n" ]
## For testing:
# puts "VARlist: $VARlist"
set VARheight [ llength $VARlist ]
## For testing:
# puts "VARheight: $VARheight"
#################################################
## To get VARwidth,
## loop through the 'lines' getting length
## of each; save max.
#################################################
set VARwidth 0
#############################################
## LOOK AT EACH LINE IN THE LIST.
#############################################
foreach line $VARlist {
#############################################
## Get the length of the line.
#############################################
set LINEwidth [ string length $line ]
if { $LINEwidth > $VARwidth } {
set VARwidth $LINEwidth
}
}
## END OF foreach line $VARlist
## For testing:
# puts "VARwidth: $VARwidth"
###############################################################
## NOTE: VARwidth works for a fixed-width font used for the
## text widget ... BUT the programmer may need to be
## careful that the contents of VARtext are all
## countable characters by the 'string length' command.
###############################################################
#####################################
## SETUP 'TOP LEVEL' HELP WINDOW.
#####################################
catch {destroy .fRtopmsg}
toplevel .fRtopmsg
# wm geometry .fRtopmsg 600x400+100+50
wm geometry .fRtopmsg +100+50
wm title .fRtopmsg "Note"
# wm title .fRtopmsg "Note to $env(USER)"
wm iconname .fRtopmsg "Note"
#####################################
## In the frame '.fRtopmsg' -
## DEFINE THE TEXT WIDGET and
## its two scrollbars --- and
## DEFINE an OK BUTTON widget.
#####################################
text .fRtopmsg.text \
-wrap none \
-font fontTEMP_varwidth \
-width $VARwidth \
-height $VARheight \
-bg "#f0f0f0" \
-relief raised \
-bd 2 \
-yscrollcommand ".fRtopmsg.scrolly set" \
-xscrollcommand ".fRtopmsg.scrollx set"
scrollbar .fRtopmsg.scrolly \
-orient vertical \
-command ".fRtopmsg.text yview"
scrollbar .fRtopmsg.scrollx \
-orient horizontal \
-command ".fRtopmsg.text xview"
button .fRtopmsg.butt \
-text "OK" \
-font fontTEMP_varwidth \
-command "destroy .fRtopmsg"
###############################################
## PACK *ALL* the widgets in frame '.fRtopmsg'.
###############################################
## Pack the bottom button BEFORE the
## bottom x-scrollbar widget,
pack .fRtopmsg.butt \
-side bottom \
-anchor center \
-fill none \
-expand 0
## Pack the scrollbars BEFORE the text widget,
## so that the text does not monopolize the space.
pack .fRtopmsg.scrolly \
-side right \
-anchor center \
-fill y \
-expand 0
## DO NOT USE '-expand 1' HERE on the Y-scrollbar.
## THAT ALLOWS Y-SCROLLBAR TO EXPAND AND PUTS
## BLANK SPACE BETWEEN Y-SCROLLBAR & THE TEXT AREA.
pack .fRtopmsg.scrollx \
-side bottom \
-anchor center \
-fill x \
-expand 0
## DO NOT USE '-expand 1' HERE on the X-scrollbar.
## THAT KEEPS THE TEXT AREA FROM EXPANDING.
pack .fRtopmsg.text \
-side top \
-anchor center \
-fill both \
-expand 1
#####################################
## LOAD MSG INTO TEXT WIDGET.
#####################################
## .fRtopmsg.text delete 1.0 end
.fRtopmsg.text insert end $VARtext
.fRtopmsg.text configure -state disabled
}
## END OF PROC 'popup_msg_var_scroll'
set HELPtext "\
\ \ \ \ \ ** HELP for this 3D f(x,y) Function Plotting Utility **
SELECTING/ENTERING A FUNCTION:
When the GUI comes up, you can use the listbox to select a
function, f(x,y), to plot. Use MouseButton1 (MB1) click-release
to put a function in the function entry field. The function
will be immediately plotted in the canvas area.
Alternatively, you may enter a function of your own
choosing in the 'function-entry-field'. The main rule to
observe is to use '\$x' and '\$y' to represent x and y. And,
of course, you should compose a syntactically-correct math
expression that is to be evaluated at each x,y location on
a rectangular grid of x,y coordinates.
---
CHANGING A FUNCTION:
You can change coefficients in a function or the formulation
of the function, in the entry field. To re-plot the new
function, you can press the Enter key --- or to re-plot at any
time, you can MB3-click-release on the 'function-entry-field'.
---
ALTERING THE GRID:
You can change the grid parameters --- xmin,xmax,x-segs,
ymin,ymax,y-segs --- by entering new values. To re-plot based
on the new grid, you can press the Enter key in any grid entry
field --- or to re-plot at any time, you can MB3-click-release
on any of the 'grid-entry-fields'.
---
CHANGING THE VIEW ANGLE:
You can use the two 'angle-scale' widgets to quickly change either
of a couple of rotation angles --- longitude and latitude.
An MB1-release of the slider on a angle-scale widget causes a replot.
You can simply keep clicking in the 'trough' of either scale
widget (to the left or right of the scale button) to step through
a series of re-plots, varying an angle one degee per click-release.
---
ZOOMING:
You can use the 'zoom-scale' widget to magnify or shrink the plot.
An MB1-release of the slider on the zoom-scale widget causes a replot.
Click in the 'trough' --- on either side of the scale's button ---
to zoom in/out a little at a time.
---
FILL/OUTLINE/BOTH:
The fill/outline/both radiobuttons allow for showing the plot
with the polygons (quadrilaterals) color-filled or not --- and
with outlines ('wireframe' mode) or not.
---
COLOR:
Three COLOR BUTTONS on the GUI allow for specifying a color for
- the interior of the polygons
- the outline of the polygons
- the (canvas) background.
---
Summary of 'EVENTS' that cause a 'REDRAW' of the plot:
Pressing Enter/Return key when focus is in the 'function-entry-field'.
Alternatively, a button3-release in the 'function-entry-field'.
Pressing Enter/Return key when focus is in the
- 'xmin' entry field
- 'xmax' entry field
- 'x-segs' entry field
- 'ymin' entry field
- 'ymax' entry field
- 'y-segs' entry field
Alternatively, a button3-release in any of the 'grid-entry-fields'.
Button1-release on the LONGITUDE or LATITUDE scale widget.
Button1-release on the ZOOM scale widget.
Button1-release on the FILL or OUTLINE or BOTH radiobuttons.
Changing color via the FILL or OUTLINE color buttons.
ALSO: Resizing the window changes the size of the canvas,
which triggers a redraw of the plot according to the new
canvas size.
---
SOME POTENTIAL ENHANCEMENTS:
Eventually some other features may be added to this utility:
- the ability to pan the plot, as well as rotate and zoom it.
- the ability to use mouse motions on the canvas to rotate,
zoom, and pan the plot --- say, MB1 to rotate, MB2 to zoom,
and MB3 to pan the surface plot.
- an option to vary the color of the filled polygons may be
added --- say, by choosing polygon color according to the
average of f(x,y) at the 4 corners of each quadrilateral
--- i.e. according to a 'z height'.
- more polygon-color assignment options may be added --- so
that the user can have colors added to polygon vertices
or polygons --- to 'liven up' the surface plot.
For example, options to assign random colors
or rainbow colors to the points/facets may be added.
- an option to shade the polygons may be added --- to change
the color of the polygon faces according to the angle
that they make with a light source. (Initially we may
assume that the light source is coming from the viewer.
But eventually we may add the ability to specify
a different, arbitrary direction of the light source.)
- more functions may be added to the listbox.
- depth clipping may be added --- so that the user
can essentially get section views of the surface.
- sorting according to 'z-depth' of the polygons could be
added --- to allow for (perhaps?) better showing/hiding
of near and far polygons.
- more elaborate shading techniques may eventually be
implemented --- to get smoother shading effects
across polygon edges, and perhaps to get glossy
effects. (These effects may be easiest to implement
by using colors assigned to polygon vertex points
rather than colors assigned to polygons.)
- add a 'triad' to show the orientation of the
xyz axes in any (re)plot.
- the list may go on."
##+######################################################
## End of PROC definitions.
##+######################################################
## Additional GUI INITIALIZATION:
## - Draw an intially-provided function on the canvas,
## so that there is an example to see on the canvas.
##+######################################################
## Set an initial function in the function-entry-field,
## so that the GUI has an example to display immediately.
# set ENTRYfunction {(2.0*$x*$x)*(2.0*$y*$y)}
# set ENTRYfunction {cos($twopi*$x)*cos($twopi*$y)}
set ENTRYfunction {cos($pi*$x)*cos($pi*$y)}
# set ENTRYfunction {(0.7-($x*$x+$y*$y))*(0.7-($x*$x+$y*$y))}
## Set xmin,xmax,Nxsegs,ymin,ymax,Nysegs values suitable
## to the initial function chosen.
set ENTRYxmin "-1."
set ENTRYxmax "1."
set ENTRYxsegs 40
set ENTRYymin "-1."
set ENTRYymax "1."
set ENTRYysegs 40
## We set the initial value for this 'scaleZOOM' widget in the
## GUI initialization section at the bottom of this script.
## (We can set this so that there is a nice margin around the
## initial plot.)
# set curZOOM 1.0
# set curZOOM 0.8
# set curZOOM 1.1
set curZOOM 1.4
## Set an initial value for the 3 radiobutton widgets for
## fill/outline/both.
set poly_filloutboth "both"
## Set the initial values for the 2 scale widgets
## that set the initial rotation angles
## (longitude and latitude).
##
## NOTE: Using the '-variable' option of the
## 'scale' widget can cause unwanted 'auto-repeat'
## behavior of the widget, so we do NOT specify
## variables. We use 'set' and 'get' instead.
if {0} {
## Start out looking at a FRONT VIEW of the model/surface.
.fRright.fRviewparms.scaleLON set 0
.fRright.fRviewparms.scaleLAT set 0
}
if {0} {
## Start out looking at a BACK VIEW of the model/surface.
.fRright.fRviewparms.scaleLON set 180
.fRright.fRviewparms.scaleLAT set 0
}
if {1} {
## Start out looking at an 'ISOMETRIC' VIEW of the model/surface.
.fRright.fRviewparms.scaleLON set 45
.fRright.fRviewparms.scaleLAT set 45
}
if {0} {
## Start out looking at a RIGHT-SIDE VIEW of the model/surface.
.fRright.fRviewparms.scaleLON set 90
.fRright.fRviewparms.scaleLAT set 0
}
if {0} {
## Start out looking at a LEFT-SIDE VIEW of the model/surface.
.fRright.fRviewparms.scaleLON set 270
.fRright.fRviewparms.scaleLAT set 0
}
if {0} {
## Start out looking at a TOP VIEW of the model/surface.
.fRright.fRviewparms.scaleLON set 0
.fRright.fRviewparms.scaleLAT set 90
}
if {0} {
## Start out looking at a BOTTOM VIEW of the model/surface.
.fRright.fRviewparms.scaleLON set 0
.fRright.fRviewparms.scaleLAT set -90
}
## We need following command because the 'draw_2D_pixel_polys' proc
## does not (re)set the background/canvas color.
## Only the background-color button-proc sets the canvas color.
.fRright.fRcan.can config -bg $COLORbkGNDhex
## We need following command because the 'draw_2D_pixel_polys' proc
## does not call the 'update_colors_label' proc to
## set the color of the color buttons and put
## the hex color values in the colors label.
## Only the color button procs call the 'update_colors_label' proc.
update_colors_label
## Rather than recompute the z values over the rectangular
## grid of xy points every time we view the plot from a
## different angle (or make other changes that do not change
## z values or grid), we load the values into an array 'aRpoints'.
## Uses
## - function in the function-entry field
## - grid-creation settings (6 x,y parms).
load_points_array
## Convert the array 'aRpoints' to Cartesian coords in array 'aRtranspoints'.
## Translates the points so they are centered at the middle of the data.
translate_points_array
## Rotate the 'aRtranspoints' points and convert to Cartesian coords that
## are stored in array 'aRnew_points'.
## Uses view angles (longitude,latitude).
rotate_points
## Loop thru the array 'aRnew_points' converting the xy coords
## (the 2D projection) to pixel coords, and plot the quadrilateral
## polygons with the 'create polygon' command.
##
## We do an 'update' command to force an initial packing of
## the GUI so that an initial canvas size is set.
## 'draw_2D_pixel_polys' queries the current canvas size to fit the
## projection points into the canvas.
##
## See the 'bind <Configure>' command below. It handles
## automatic redraws whenever the user changes the
## window size, and thus the canvas size.
##
## Uses
## - fill, outline, and zoom settings
## - colors
update
draw_2D_pixel_polys
## From now on, if the canvas is resized, we do an automatic redraw
## via the 'wrap_draw_2D_pixel_polys' proc.
set PREVcanWidthPx [winfo width .fRright.fRcan.can]
set PREVcanHeightPx [winfo height .fRright.fRcan.can]
bind .fRright.fRcan.can <Configure> "ReDraw_if_canvas_resized"
##+#######################################################################
## ****
## NOTE: If a new function is to be added to the functions listbox:
## ****
## the user can edit this script and add to the 'insert end' statements
## near the 'listbox' statement that defines the listbox widget.
##+######################################################################
Here is an example of the result of changing the default fill, outline, and canvas colors.
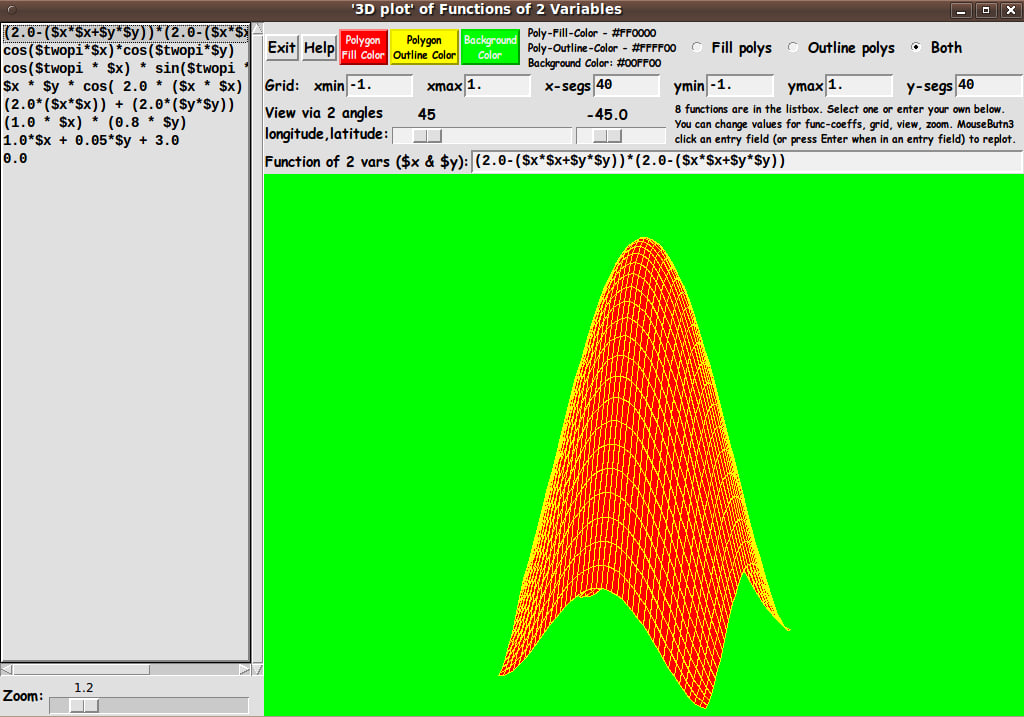
SOME POTENTIAL ENHANCEMENTS:
Eventually some other features may be added to this utility:
- the ability to pan the plot, as well as rotate and zoom it.
- the ability to use mouse motions on the canvas to rotate, zoom, and pan the plot --- say, MB1 to rotate, MB2 to zoom, and MB3 to pan the surface plot.
- an option to vary the color of the filled polygons may be added --- say, by choosing polygon color according to the average of f(x,y) at the 4 corners of each quadrilateral --- i.e. according to a 'z height'. (A preliminary version has been DONE. See image and discussion below.)
- more polygon-color assignment options may be added --- so that the user can have colors added to polygon vertices or polygons --- to 'liven up' the surface plot. For example, options to assign random colors or rainbow colors to the points/facets may be added.
- an option to shade the polygons may be added --- to change the color of the polygon faces according to the angle that they make with a light source. (Initially we may assume that the light source is coming from the viewer. But eventually we may add the ability to specify a different, arbitrary direction of the light source.)
- more functions may be added to the listbox. (Many were added in 2012dec28 update. See image below.)
- depth clipping may be added --- so that the user can essentially get section views of the surface.
- sorting according to 'z-depth' of the polygons could be added --- to allow for (perhaps?) better showing/hiding of near and far polygons.
- more elaborate shading techniques may eventually be implemented --- to get smoother shading effects across polygon edges, and perhaps to get glossy effects. (These effects may be easiest to implement by using colors assigned to polygon vertex points rather than colors assigned to polygons.)
- add an option to show a 'triad', to show the orientation of the xyz axes in any (re)plot.
- add a check-button to switch to perspective projection, instead of parallel projection.
- add a check-button to turn on culling of 'back faces'.
I may add a few more ideas for enhancements in coming months, as I tackle other 3D utilities.
uniquename 2012dec17 UPDATE
I added a display of milliseconds to do each redraw --- to help get an idea of whether the 'model' (data-surface or data-cloud) can be rotated smoothly via mouse motions on the canvas.
The milliseconds are displayed in the label widget to the right of the longitude-latitude scale widgets.
If we can do redraws in about 50 milliseconds (corresponding to a 'frame rate' of 20 frames per second), we should be able to rotate the data cloud rather smoothly.
It turns out that a 40x40 data grid was re-drawing at around 70 milliseconds (plus or minus about 10 milliseconds), on my computer.
Not surprisingly, an 80x80 data grid was taking about 3 to 4 times as long for a re-draw --- about 220 milliseconds.
If this script is enhanced to allow for 'immediate' rotation according to mouse motion on the canvas, then the rotation may be a bit 'jumpy' for large grids but may be pretty smooth for grids on the order of 30x30 (about 1,000 points and a similar number of polygons).
There may be some ways to change the calculations to get a significant speed up of the redraws and thus allow for smooth rotation of larger grids.
___
Besides the addition of the redraw-milliseconds display, this update included a few changes to the 'rotate' proc and changes to some scale parameters for the three scale widgets. Some font inconsistencies and digits-displayed inconsistencies of a couple of the scales were fixed.
Also, '-repeatdelay 500' and '-repeatinterval 50' parameters are now present on all three scales. If the responsiveness of the sliderbar movements (when clicking-and-holding in a trough) is not to your liking, you can change these milliseconds values.
I replaced the code above with the new code.
uniquename 2012dec18 UPDATE
When the user chooses the 'fill-only' (no outlines) radiobutton, the plot looks like a blob of solid color, when all the polygons are painted the same fill color.
So, like MM did with the gray color option of his 3D function viewer, I have added some code to the 'draw_2D_pixel_polys' proc to provide gradation of the fill color of polygons according to the average z-height of each polygon.
Here is an example plot.
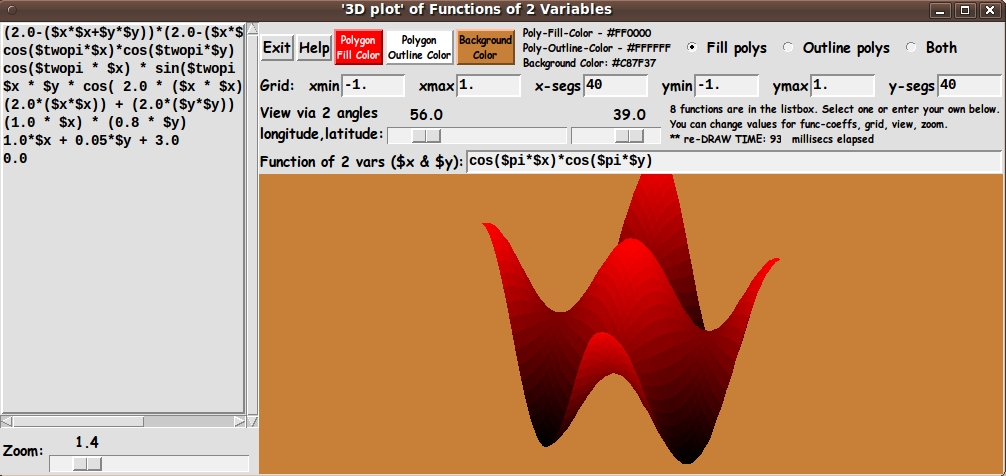
This is a somewhat 'expensive' operation. The draw times went up a factor of about 50% --- from about 65 millisecs to about 95 millisecs. So this gradation of the user-selected fill-color is done only in the case that the user chooses 'fill-only' (no outlines).
(Note: The color assignment according to z-height can be improved. This was just a first attempt. If it turns out that the 'format' command is eating up most of the time, I can probably get a big improvement by using an index into a table of about 20 colors, instead of using 'format'. Also, I can get some improvement during rotation of the model by computing the 4-vertex average z-height of the polygons just one time for a given function and grid --- and storing the averages in an array for repeated use. I.e. gain some speed at the cost of some memory. I will probably return to this issue someday and provide a significantly faster z-height-color-assignment routine.)
I replaced the code above with the new code.
uniquename 2012dec28 UPDATE
I added about 40 functions to the functions listbox --- including some functions that give sombrero-like surfaces. Here is a sombrero image reduced to about 70% of original size.
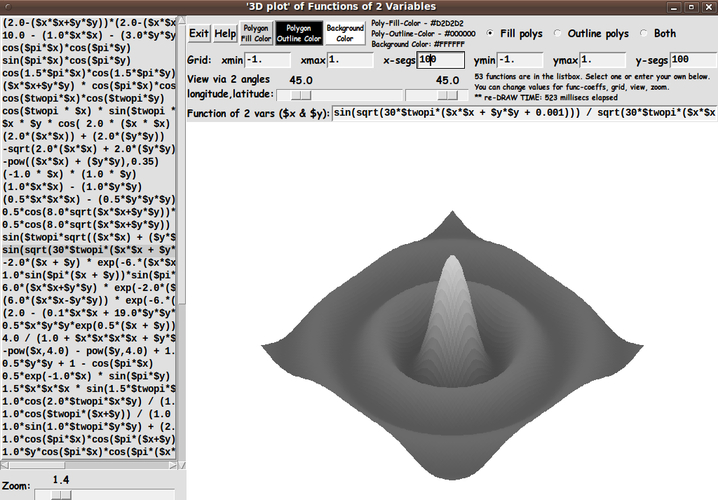
This image is done with 'fill-only' (no outlines). In that case, the z-height-color-assignment routine was automatically invoked, as mentioned above, in order to get an image that was not just a blob of solid, unshaded color --- in this case, gray.
I replaced the code above with the new code.