Bwise deCasteljau algorithm example
by Theo Verelst
Doing subdivision on bezier surfaces is an interesting and efficient curve of surface subdivision algorithm built from cheap computer operations, additions and divisions by two.
The area of curved surfaces, and especially bezier and rational bezier curves and (3d) surfaces by itself is interesting too, and will receive separate attention.
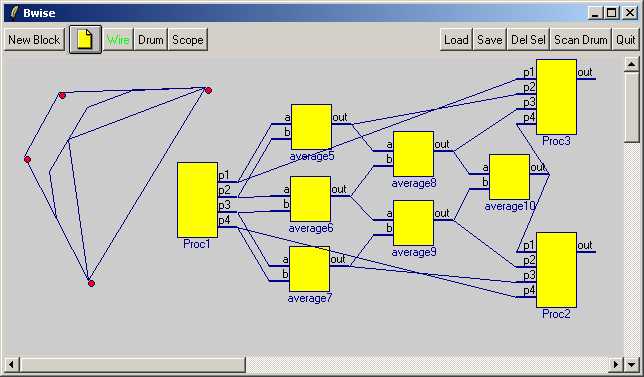
On this page I show a bwise graphical representation of the de Casteljau algorithm, which consists of 3 curves of which the first can be altered by dragging control points (see also Interactive Polygon in Bwise), and bwise block schema of the subdivision algorithm, which can be 'run' in real time to create 2 subdivided curves which are updated automatically.
The basic computation block is a averaging operation (a+b/2) which we implement in a variable vector / list length sense (this procedure must be defined for all scripts on this page):
 proc average { {a} {b} } {
   set o {}
   for {set i 0} {$i < [llength $a]} {incr i} {
      lappend o [expr ([lindex $a $i]+[lindex $b $i]) / 2]
   }
   return $o
 }
We need 6 instances of this function in our bwise canvas deCasteleau, which is most neatly and conveniently done by using the upgraded function window from Automatically generate Bwise blocks from procedures which allows selecting the function from the refreshed table by double clicking, and pressing the bottom 'block' button to create separately named bwise blocks which implement this function of 2 arguments with return value.
To create 'control points' I use a script from the aforementioned page which lets you create red dots anywhere on the canvas by clicking on the background, for this example you must make sure you have exactly 4 control points:
 set markercount 0;
 bind $mc <Button-1> {
       global markercount;
       set cx [$mc canvasx %x]
       set cy [$mc canvasy %y]
       set t  "[$mc find overlapping [expr $cx-1] [expr $cy-1] $cx $cy]";
       if {$t == {}} {
           $mc create oval [expr $cx-3] [expr $cy-3] [expr $cx+3] [expr $cy+3] \
            -fill red -outline navy -width 1 -tags "mark[incr markercount] markers"
       }
    }
These markers are bound to a bit upgraded button release script, which draws a polygon trough them (and does currently so by closing the polygon, which is not optimal):
   $mc bind markers <ButtonRelease-1> {
      set t {}; set j 0
      foreach i [$mc find withtag markers] {
         set t1 "[lrange [$mc coords [lindex [$mc itemcget $i -tags] 0] ] 0 1] "
   #      puts $t1
         append t $t1
         if {$j < 4} { set Proc1.p[expr $j+1] $t1 }
         incr j
      } ;
      eval $mc coords markerpoly $t ; $mc raise markers
   }

 $mc create poly 0 0 5 5 10 3 3 93 -tag markerpoly -fill {} -outline navy
The polygon is created one, and is subsequently updated to follow the control points.
To create the rest of the blocks from the example windowdump:
 newproc { } {} {} {p1 p2 p3 p4}
 newproc {} {} {p1 p2 p3 p4}
 newproc {} {} {p1 p2 p3 p4}

 set Proc2.bfunc {set o {}; foreach i {1 2 3 4} {eval lappend o [set Proc2.p$i]} ; $mc coords bez1 $o }
 set Proc3.bfunc {set o {}; foreach i {1 2 3 4} {eval lappend o [set Proc3.p$i]} ; $mc coords bez2 $o }
Obviously, you'll have to make the connections between the blocks, too, and drag them into place. Finally, these two polygons are changed by the Proc2 and Proc3 blocks when the sequence of bwise blocks is started by net_funprop Proc1 (or the right-click popup menu Funprop on that block):
 $mc create poly 0 0 5 5 10 3 3 93 -tag bez1 -fill {} -outline navy
 $mc create poly 0 0 5 5 10 3 3 93 -tag bez2 -fill {} -outline navy
The first control polygon defines a bezier curve, while the two subdivided control polygons span bezier curves which together span exactly the same curve. The process of course can be repeated, and can be proven to converge to the actual bezier curve (not yet shown here).
Of course a next step is to do the subdivision to a deeper level, and possibly make that a bwise graph, and on the other side make a bit more efficient implementation. My (Master) thesis had as a part these computations (in C) to deal with 3D rational cubic bezier surfaces efficiently, which is quite a valid idea, still. also in the time of fast graphics (polygon rendering) cards.
The right bottom and top control dots are the end points of the defining bezier control polygon. The midpoint in the middle is where the new control polygons of the split curve meet.
aug 20 05 TV I've made an easy to load in all at once bwise file for the above:
[L1 ]
Move the control red dots around by dragging, and push right-click-->funprop on the Proc1 block to see the subdivided curves' control polygons get updated.
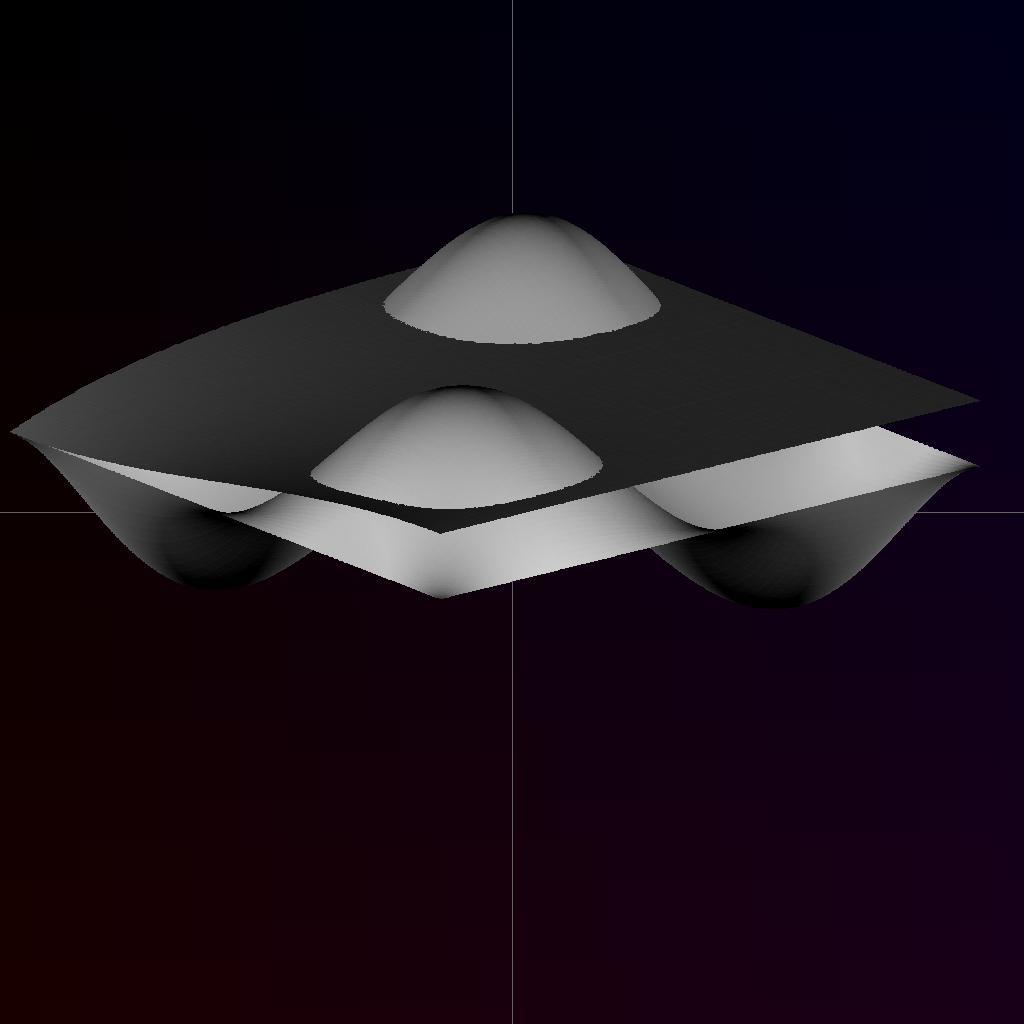
I've recently done a C rendering program on the basis of the above subdivision algorithm, which can make images from bezier 3D (not 2D) surfaces, which is a preparation for more (tcl/tk) related work in the direction:
Example image, took a number of seconds on a fast machine. Images can be made smaller by adjusting the w and h in main, and of course it makes sense calling this from tcl and adding a tk interface.
Here's a link to the C code, it's not finished or extensively tested, but the code directly responsible for the above image, with the datafile (in the same directory) below:
   http://www.theover.org/Wiki/makeppm.c
   http://www.theover.org/Wiki/test.cb
My masters' thesis was about also this stuff, so don't expect all too pityfull programming / thinking is these examples (smiley would be in place..) ! I redid this without having anything available but memory, though, in fact in one night. It's fun stuff. more will follow.
It's only 10K of source code including some comments. Simply compile and run, and then for instance use:
exec cjpeg -outfile image.jpg im.ppm
to view the image. Or make a canvas and use: image create photo -file im.ppm .
Another subject, where I was the originator of the idea (but got only mentioned in the acknowledgments..) in computer graphics is grouping, [L2 ] and of course graphics languages are important, I made the object oriented Hierarchical Graphics Format language which was used to do the modeling at the end of the article. A language to define readable and large databases graphics objects and transformations, which get interpreted, and turned into a dynamic Objective C based object tree, which at the time could be pretty big (interactiveness with >30,000 objects in around 1991). The language bears resemblance with tcl (which I didn't know at the time). The above graphics example file test.cb could well be generated and processed using tcl lists.
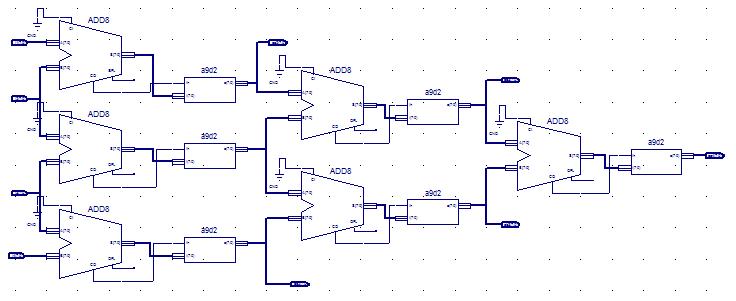
TV (Dec 2 2005) I've done a Xilinx implementation of the basic bezier subdivision (in this case 8 bit only, but it appears to take at least less then 20 nS per full subdivision..) , where the tcl script from Bwise, a serial port tcl script and a Xilinx demo board and the above BWise example can be used in hardware:
The whole test design is here:
[L3 ] (TV mar 19 '06 I've made a 32 bit software and fpga version prepared for siggraph, open source downloadable [L4 ] .)


